
中国企业债务的重要特征与近期演变
Features and Recent Evolution of Corporate Debt in China
-
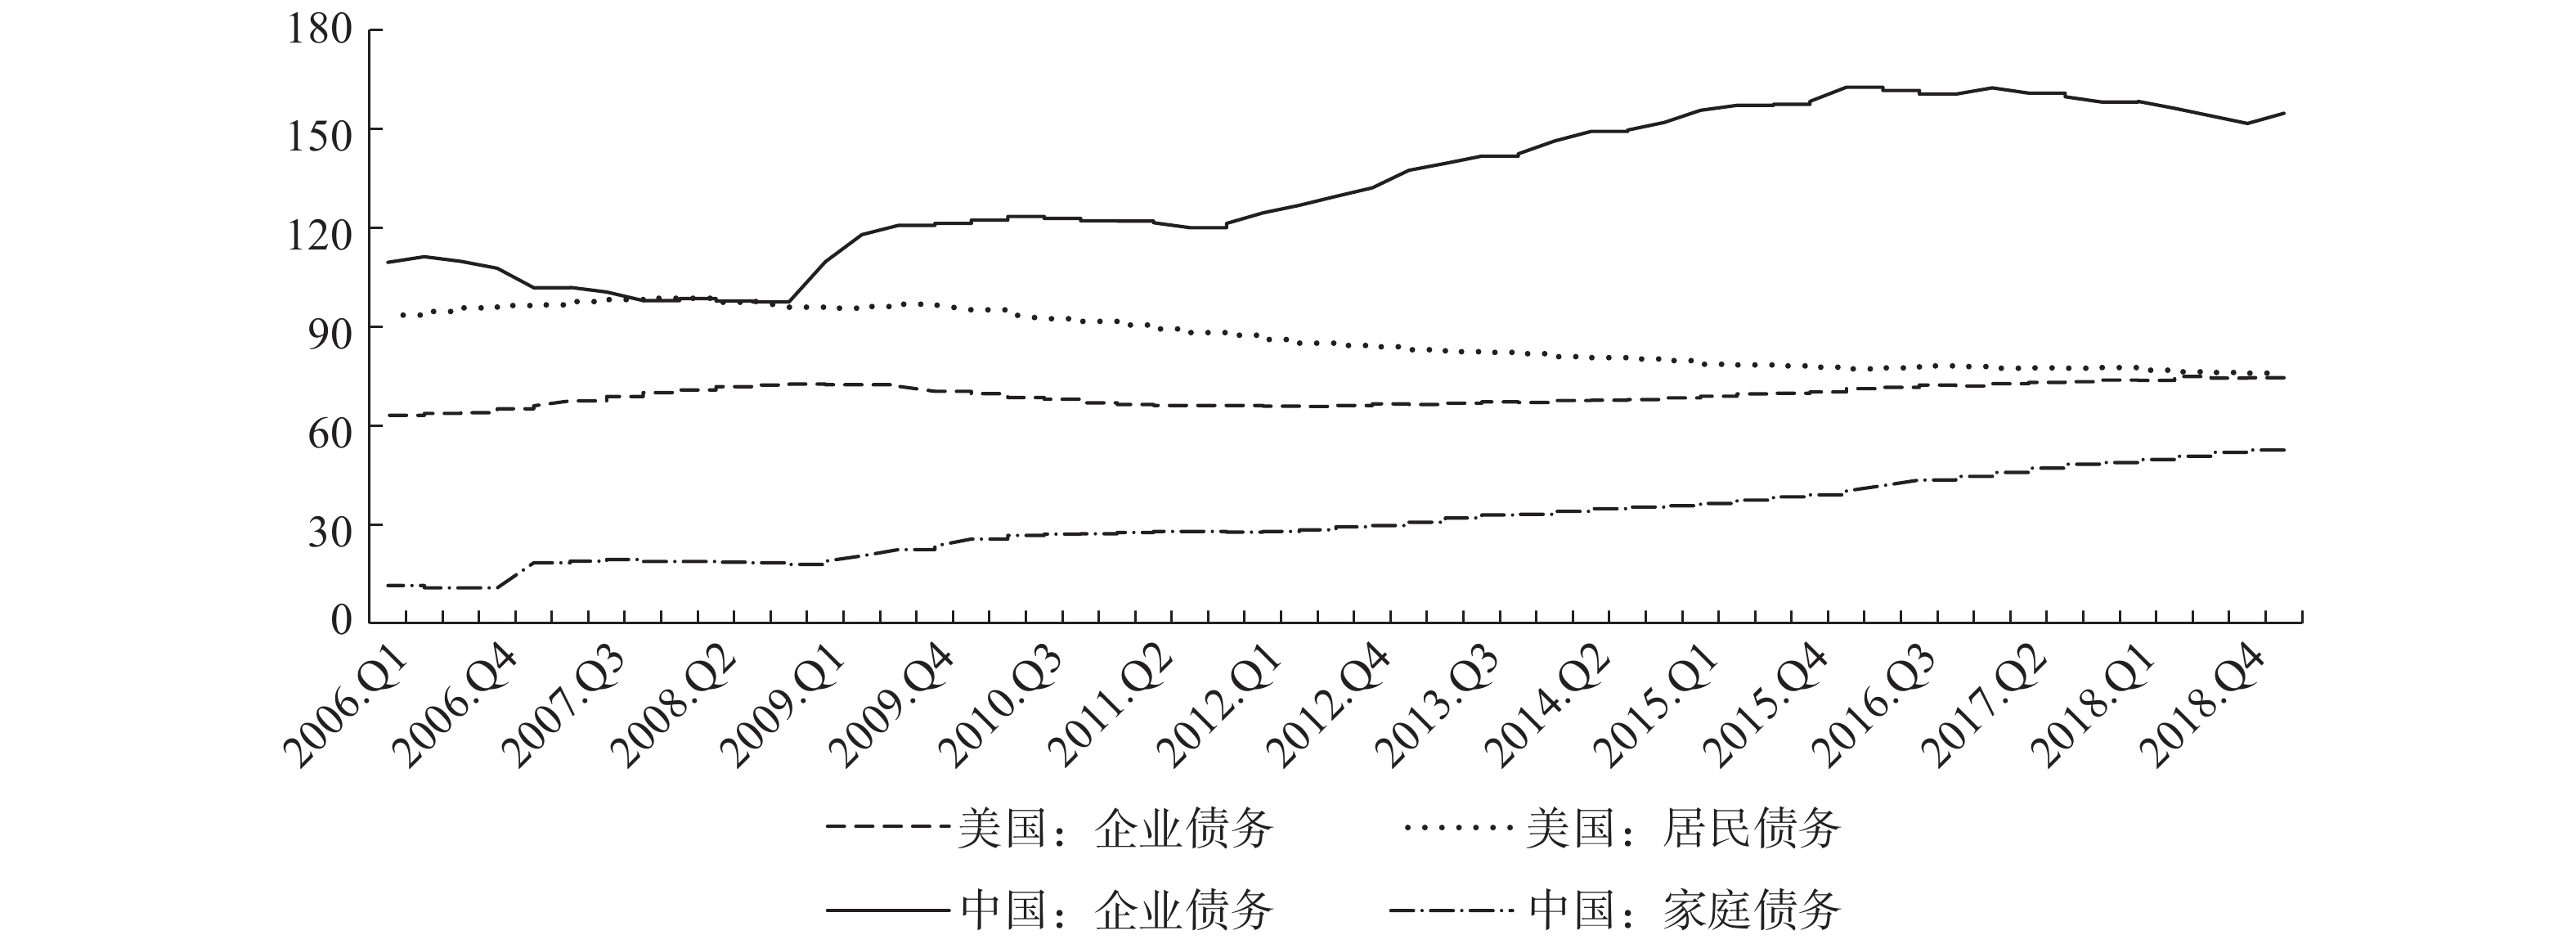
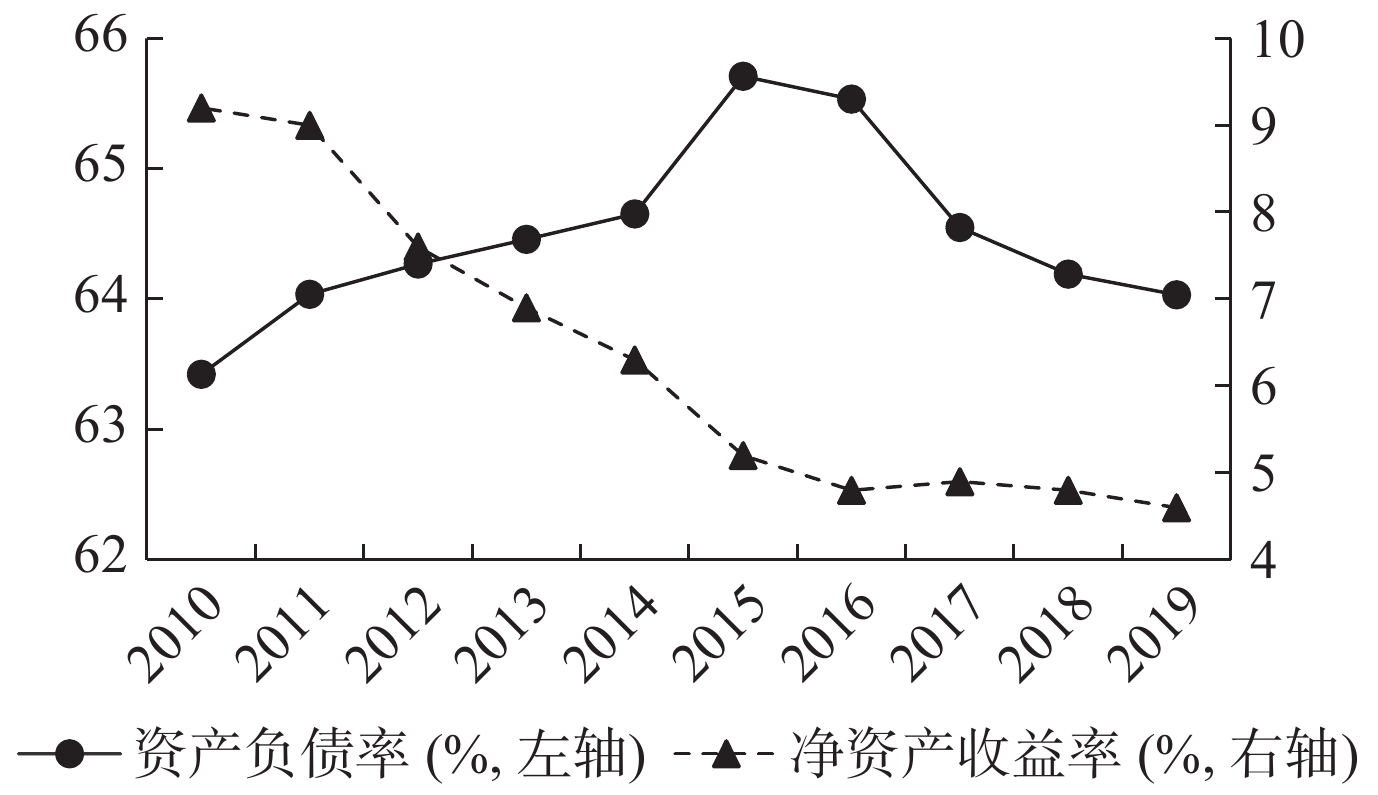
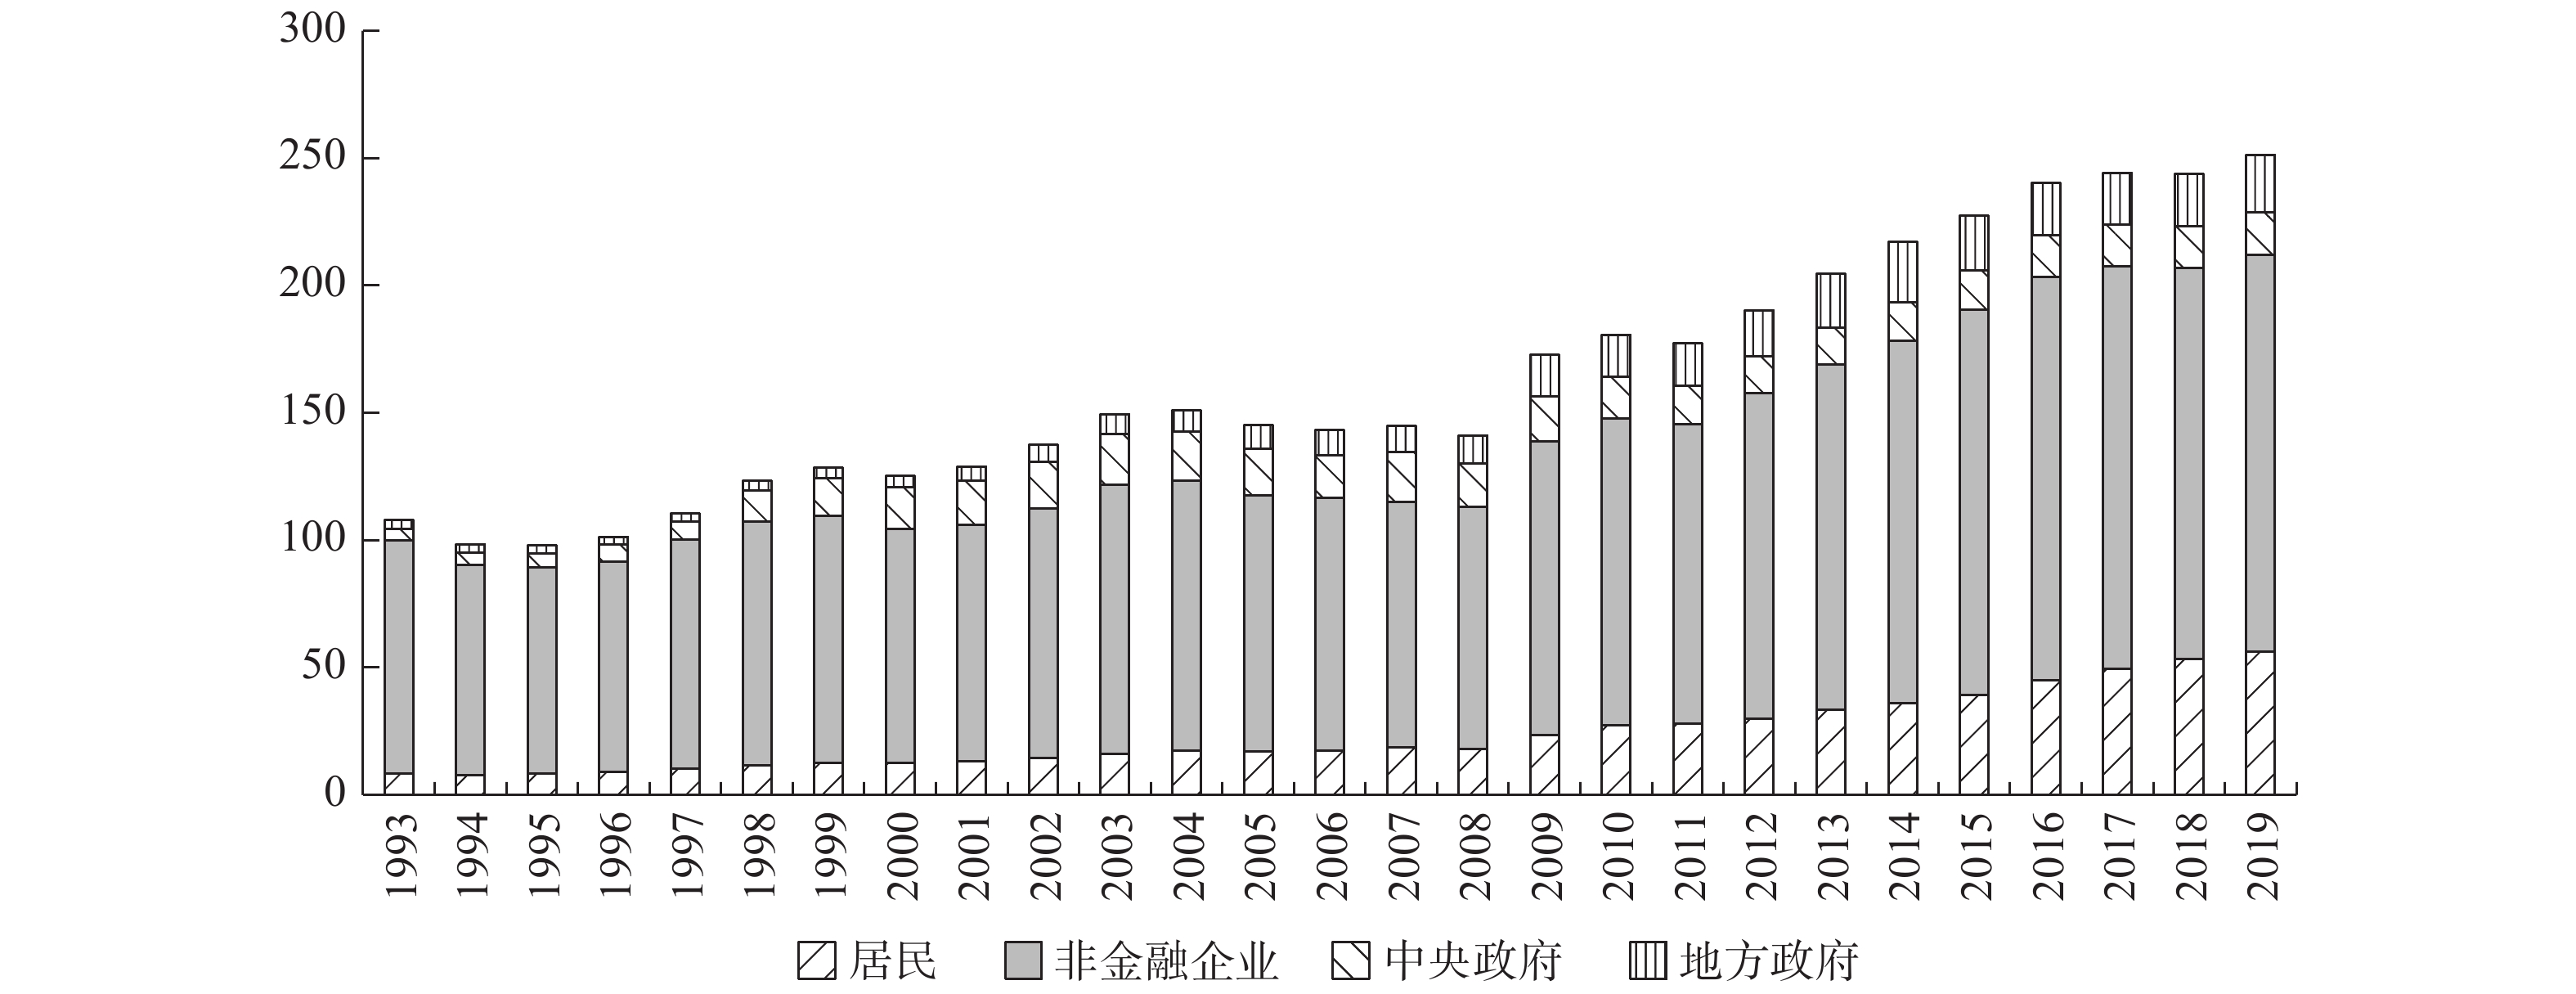
摘要: 近年来,中国企业债务的激增引发了世界范围内的较大关注与讨论,为此有必要考察中国企业债务的重要特征与近期演变,尤其是关注供给侧结构性改革与新冠疫情对企业债务的影响。研究发现:与美国主要是家庭部门借债不同,自2008年以来,中国主要是由非金融企业部门推动着债务总额与GDP比率的快速上升。更重要的是,中国企业债务具有高度的“结构性特征”,即大部分债务集中在一小部分企业。2015年以来实行的供给侧结构性改革有效降低了国有企业的负债率并提升了其业绩水平。与此同时,新冠肺炎疫情对中国去杠杆进程的影响是有限的。深化资本市场改革以提高企业的直接融资比重,并同时深化国有企业改革,对于缓解中国的企业债务风险至关重要。Abstract: This paper examines the important features and recent evolution of China’s corporate debt, paying particular attention to the impact of supply-side structural reforms and of COVID-19 on corporate debt. First, we find that the non-financial corporate sector is the main driver of the rapid rise in China’s total debt-to-GDP ratio since 2008, unlike the U. S., where the household sector borrows the most. More importantly, China’s corporate debt is found highly “structural”, due to its large concentration in a fraction of firms. What is worth noting is that the supply-side structural reforms implemented since 2015 have effectively reduced the debt ratios of SOEs and improved their performance. Meanwhile, the impact of COVID-19 on the deleveraging process in China appears limited. It is crucial to mitigate China’s corporate debt risks by deepening capital market reforms to increase the share of direct financing for enterprises and simultaneously accelerating SOE reforms.
-
Key words:
- corporate debt /
- supply-side structural reform /
- COVID-19
-
表 1 各行业增加值的季度增速(%)
Q2 2020 Q1 2020 Q2 2019 Q1 2019 国内生产总值 3.2 −6.8 6.2 6.4 第一产业 3.3 −3.2 3.3 2.7 第二产业 4.7 −9.6 5.6 6.1 第三产业 1.9 −5.2 7.0 7.0 其中: 农业、林业、畜牧业和渔业 3.4 −2.8 3.4 2.9 制造业 4.4 −10.2 5.5 6.5 建筑业 7.8 −17.5 5.1 6.2 批发和零售业 1.2 −17.8 6.0 5.8 交通运输、仓储和邮政业 1.7 −14.0 7.3 7.3 住宿和餐饮业 −18.0 −35.3 6.4 6.0 金融业 7.2 6.0 7.6 7.1 房地产 4.1 −6.1 2.5 2.6 信息传输、软件和信息技术服务业 15.7 13.2 20.1 21.2 租赁和商业服务业 −8.0 −9.4 7.5 8.5 其他行业 −0.9 −1.8 5.7 5.5 数据来源:中国国家统计局。  下载: 导出CSV
表 2 新冠疫情对各行业公司盈利能力的影响
行业 营业收入
同比增长净利润
同比增长毛利率 费用率 净资产报酬率 Q1 2019 Q1 2020 Q1 2019 Q1 2020 Q1 2019 Q1 2020 同比
变化Q1 2019 Q1 2020 同比
变化Q1 2019 Q1 2020 同比
变化综合 39% −86% 110% −68% 8% 10% 2% 7% 17% 9% 1% 1% 0% 休闲服务 27% −52% 85% −155% 42% 44% 2% 33% 41% 9% 3% −2% −6% 家用电器 6% −32% 7% −56% 24% 25% 1% 17% 17% 0% 4% 2% −2% 汽车 −5% −28% −26% −79% 16% 15% −1% 12% 14% 2% 2% 0% −2% 建筑材料 28% −21% 46% −44% 29% 28% −2% 13% 18% 5% 3% 1% −2% 化工 14% −18% −22% −107% 20% 17% −2% 7% 8% 1% 2% 0% −2% 商业贸易 14% −15% 22% −75% 15% 15% 0% 12% 13% 1% 2% 1% −2% 传媒 8% −13% −21% −51% 28% 26% −2% 18% 22% 4% 2% 1% −1% 轻工制造 1% −12% −24% −30% 22% 22% −1% 16% 18% 2% 2% 1% −1% 纺织服装 −5% −10% −3% −80% 30% 32% 2% 22% 21% −1% 2% 1% −2% 通信 1% −10% 575% −44% 25% 27% 2% 20% 21% 1% 1% 1% −1% 电气设备 21% −9% 14% −2% 22% 22% −1% 17% 18% 0% 1% 1% 0% 建筑装饰 14% −9% 19% −29% 11% 11% 0% 6% 6% 0% 2% 1% −1% 机械设备 11% −9% 38% −42% 22% 23% 2% 16% 18% 2% 2% 1% −1% 采掘 10% −8% 6% −73% 23% 23% −1% 8% 9% 1% 2% 0% −1% 计算机 18% −8% 59% −114% 26% 25% 0% 22% 27% 5% 1% 0% −1% 公用事业 20% −8% 30% −18% 20% 21% 1% 11% 13% 2% 2% 1% −1% 医药生物 22% −1% 22% −11% 35% 34% −1% 24% 24% −1% 3% 2% −1% 房地产 23% −1% 27% −30% 31% 32% 1% 12% 13% 1% 2% 1% −1% 钢铁 5% 0% −44% −35% 15% 10% −4% 6% 7% 1% 2% 1% −1% 交通运输 0% 3% 26% −119% 13% 14% 2% 7% 8% 1% 3% 0% −3% 食品饮料 16% 3% 24% 1% 50% 51% 1% 18% 17% 0% 7% 6% −1% 电子 100% 5% 13% −9% 22% 15% −7% 11% 12% 0% 2% 1% 0% 农林牧渔 15% 7% −36% 249% 17% 14% −2% 11% 10% −1% 1% 4% 3% 有色金属 7% 8% −34% −43% 12% 10% −2% 6% 6% −1% 1% 1% −1% 国防军工 7% 27% −12% 246% 14% 14% 0% 13% 13% 0% 0% 1% 1% 平均 16% −12% 35% −31% 23% 22% 0% 14% 16% 2% 1% 1% −1% 注:净资产报酬率=净利润/所有者权益,毛利率=毛利/营业收入,费用率=财务、销售、一般及行政费用的总和/营业收入;各行业按其2020年第一季度的经营收入同比增长升序排列。
数据来源:CSMAR数据库,作者计算得到。
下载: 导出CSV
表 3 新冠肺炎疫情对各行业企业偿付能力、负债率和融资活动的影响
行业 流动比率 利息保障
倍数经营性现金流/
财务费用资产负债率 经营负债/
负债总额债务相关的筹资
活动现金流入
同比增长Q1
2019Q1
2020同比
变化Q1
2019Q1
2020同比
变化Q1
2019Q1
2020同比
变化Q1
2019Q1
2020同比
变化Q1
2019Q1
2020同比
变化Q1
2019Q1
2020医药
生物1.67 1.67 −0.01 9.58 10.75 1.17 0.03 1.30 1.27 48% 49% 1% 35% 31% −3% 5% 225% 交通
运输0.92 0.92 0.00 6.83 0.50 −6.33 3.01 −3.06 −6.07 37% 40% 3% 55% 49% −6% 23% 83% 食品
饮料2.48 2.44 −0.04 56% 56% 0% 48% 44% −3% −3% 58% 农林
牧渔1.18 1.27 0.08 4.18 11.01 6.83 3.04 4.39 1.35 54% 53% −1% 46% 42% −4% 15% 55% 化工 1.06 0.98 −0.08 6.59 0.48 −6.12 0.43 −5.93 −6.36 80% 79% −1% 48% 27% −21% 22% 50% 采掘 0.97 0.85 −0.12 5.63 2.74 −2.90 7.78 1.70 −6.08 42% 49% 7% 47% 49% 2% −3% 27% 建筑
材料1.39 1.45 0.06 10.58 5.20 −5.38 1.48 −3.81 −5.28 57% 57% 0% 48% 43% −5% 16% 26% 电子 1.42 1.45 0.03 3.99 4.30 0.30 3.19 3.69 0.50 63% 62% −1% 18% 16% −2% 59% 25% 建筑
装饰1.15 1.17 0.02 4.51 3.86 −0.66 −20.08 −23.93 −3.85 51% 49% −2% 62% 49% −13% 31% 24% 机械
设备1.43 1.44 0.01 5.91 3.85 −2.06 −1.81 −5.71 −3.91 52% 53% 2% 36% 30% −5% 4% 24% 纺织
服装1.83 1.50 −0.34 10.76 3.21 −7.55 1.30 −3.44 −4.74 54% 55% 1% 51% 47% −4% −16% 23% 有色
金属0.77 0.80 0.03 4.40 3.18 −1.22 3.56 0.42 −3.15 41% 42% 1% 53% 44% −9% 17% 21% 商业
贸易1.15 1.10 −0.05 5.71 2.22 −3.49 −1.51 −4.69 −3.18 62% 60% −3% 52% 48% −4% 46% 17% 国防
军工1.54 1.62 0.08 8.67 −52.40 42% 41% −2% 43% 40% −3% 21% 16% 汽车 1.25 1.22 −0.03 8.04 2.88 −5.16 −6.28 −4.92 1.35 76% 75% −1% 49% 43% −6% 15% 14% 房地产 1.48 1.40 −0.07 5.82 3.83 −1.99 −7.39 −10.37 −2.98 58% 57% −1% 23% 19% −4% 16% 13% 公用
事业0.66 0.71 0.05 2.86 2.38 −0.47 3.25 2.84 −0.41 46% 46% 0% 38% 33% −6% 13% 11% 计算机 1.82 1.81 −0.01 9.25 1.22 −8.03 −26.90 −29.72 −2.82 58% 58% 0% 51% 48% −3% 3% 9% 钢铁 1.14 1.07 −0.07 2.95 2.13 −0.82 1.49 2.15 0.67 52% 50% −2% 31% 30% −1% 13% 8% 休闲
服务1.60 1.44 −0.16 14.92 11.12 −13.33 −24.45 57% 60% 3% 51% 40% −11% 40% 5% 传媒 1.84 1.64 −0.19 11.36 6.64 −4.72 −1.33 −0.31 1.02 31% 31% 1% 67% 47% −20% 17% 4% 轻工
制造1.25 1.33 0.07 3.94 3.21 −0.73 0.51 −0.69 −1.20 49% 47% −1% 53% 54% 0% 22% 3% 电气
设备1.44 1.39 −0.05 3.35 4.15 0.80 −4.45 −4.22 0.23 44% 44% 0% 40% 39% −2% 14% −7% 家用
电器1.27 1.33 0.06 20.08 17.68 43% 44% 0% 50% 45% −5% 21% −32% 通信 0.98 1.09 0.11 6.00 4.35 −1.65 5.70 3.42 −2.28 55% 56% 1% 24% 23% −1% 74% −39% 综合 1.37 1.28 −0.09 2.59 2.48 −0.11 −3.29 −1.87 1.42 64% 55% −9% 30% 32% 2% 50% −85% 平均值 1.35 1.32 −0.03 7.14 3.84 −2.29 −2.47 −4.18 −3.00 53% 53% 0% 44% 39% −5% 21% 22% 注:流动比率=流动资产/流动负债;利息保障倍数=(净利润+所得税费用+财务费用)/财务费用,资产负债率=总负债/总资产;经营负债包括应付票据、应付账款、预付款、应付工资、应付税款和其他应付款项。各行业按2020第一季度的债务融资活动现金流入同比增长的降序排列。数据来源:CSMAR数据库,作者计算得到。
下载: 导出CSV
-

 下载:
下载:


 点击查看大图
图(8)表(3)
计量
- 文章访问数: 7899
- HTML全文浏览量: 658
 沪公网安备 31010102003103号