
最大用电负荷与经济变量的关联研究
A Study on the Relationship between Maximum Power Load and Economic Variables
-
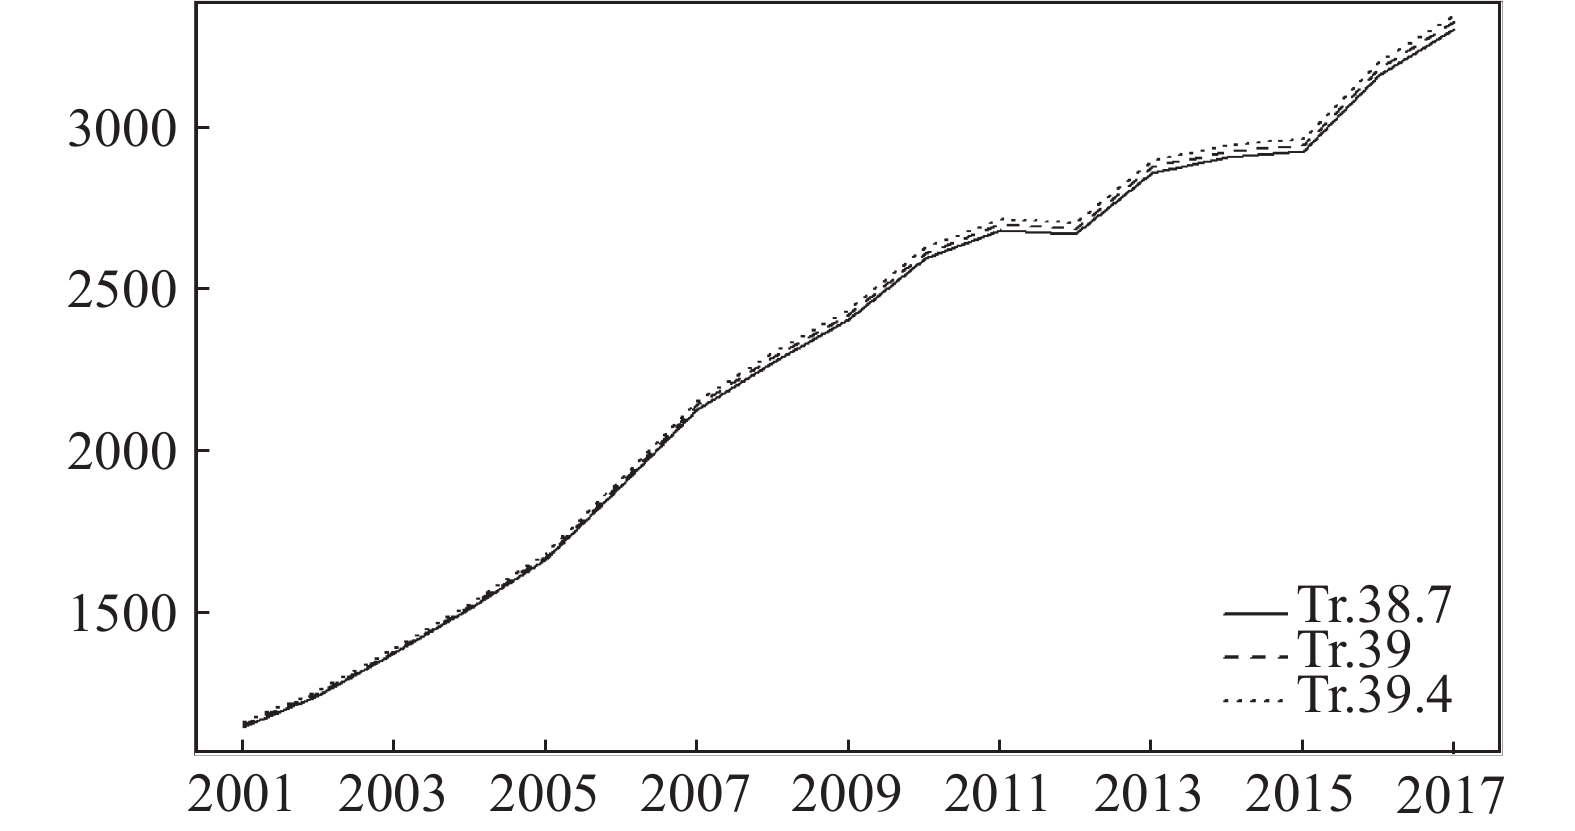
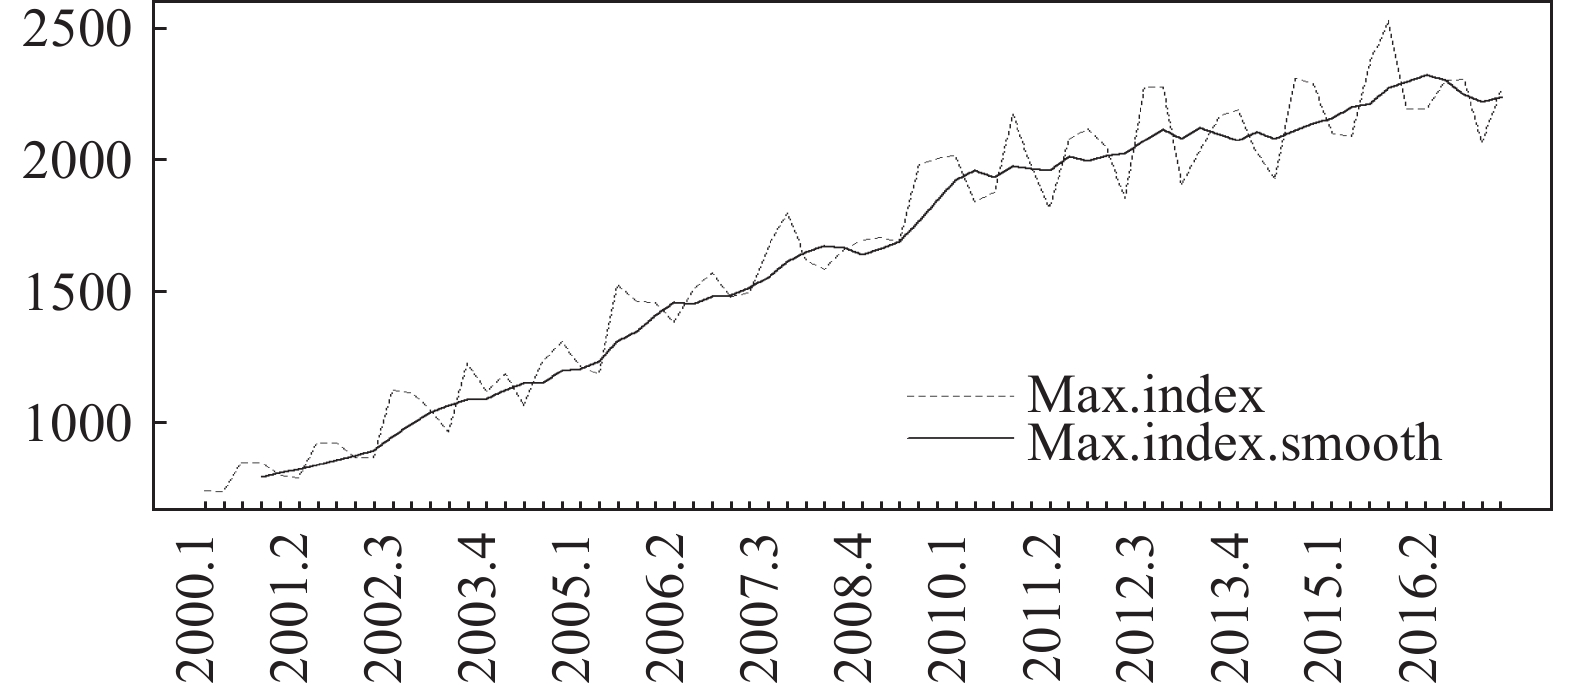
摘要: 用电负荷的估计与预测是经济社会稳定发展的重要因素。以用电负荷数据为导向,发现在高温天气当降温用电设备处于满负荷运行的状态下,用电负荷基本上由经济因素所决定,从而分离经济和气温两个对电力需求影响的因素,提出一种对不可观测最大基准用电负荷的估计方法以准确预测最大用电负荷。运用特征指数方法构建最大基准用电负荷指数,探索其与经济变量之间的关系。以上海为例构建年度和季度的最大基准用电负荷指数,发现其与经济发展高度拟合,反映近年来上海在产业结构调整方面卓有成效。本文以数据为导向,挖掘数据的充分信息,从新的视角估计最大基准用电负荷,以其为桥梁达到准确预测最大用电负荷的目标,为经济形势与转型的预判提供有效分析和数据支持。Abstract: This paper introduces a kind of estimation method of the unobservable base maximum power load and forecasting the maximum power load, then use Hedonic Method to construct the base maximum power load index and explore its relationship with economic variables. The influence of economic and temperature factors on the power load are separated. Then the base maximum power load sequence is estimated. We use yearly and seasonal base maximum power load index of Shanghai as an example, finding that this index is highly matching with economic development, reflecting the characteristics of Shanghai industrial structure adjustment. These methods are driven by data, mining the full information of the data, providing a new view of estimating the base power load, and supporting the analysis and forecast of economy more effectively and accurately.
-
Key words:
- maximum power load /
- base temperature /
- Hedonic Index
-
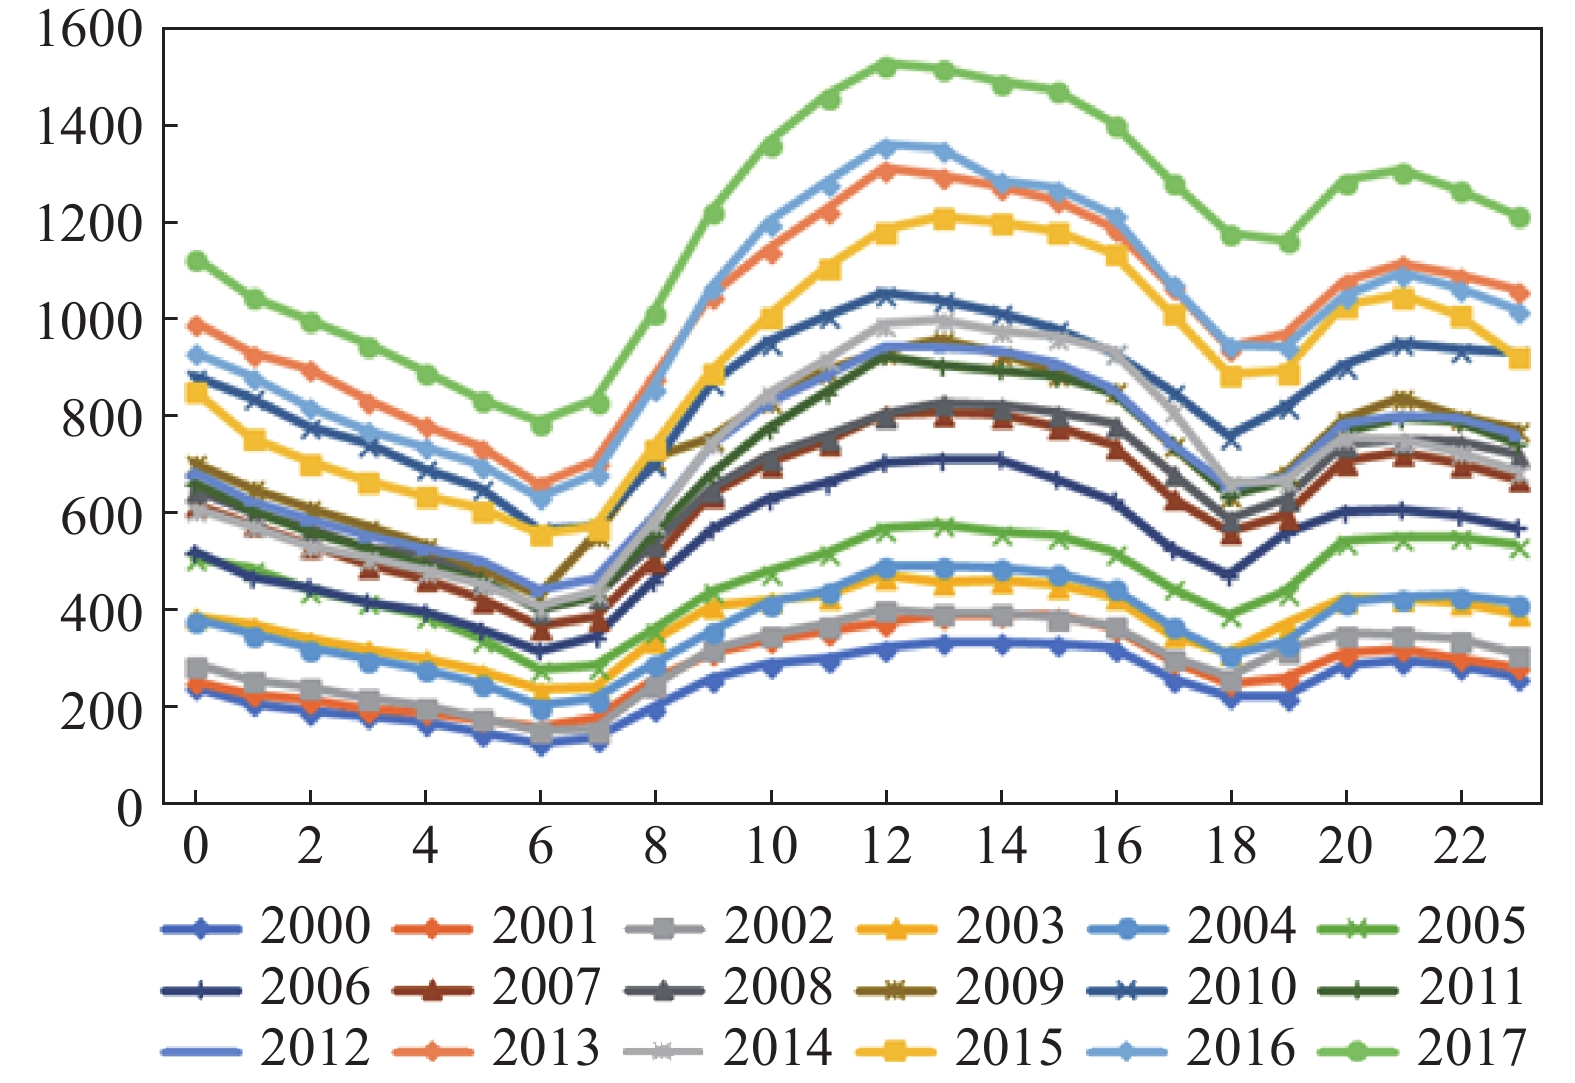
表 1 日用电负荷数据的描述性统计
电力数据 日电量(亿千瓦时) 日最大负荷(万千瓦) 日最小负荷(万千瓦) 年份 平均数 中位数 标准差 平均数 中位数 标准差 平均数 中位数 标准差 全样本 2.98 3.02 0.98 1463.90 1467.60 487.48 948.24 973.10 307.48 2000 1.50 1.45 0.19 744.24 723.35 103.45 473.24 461.15 54.08 2001 1.58 1.53 0.21 785.58 761.10 115.92 498.15 485.60 55.79 2002 1.72 1.70 0.23 857.91 841.20 127.10 540.20 533.00 59.70 2003 1.99 1.91 0.29 989.06 958.70 152.90 626.09 603.40 81.39 2004 2.20 2.13 0.29 1083.48 1051.40 148.94 699.87 679.35 79.86 2005 2.47 2.39 0.34 1214.75 1175.80 174.12 785.26 762.10 91.54 2006 2.69 2.58 0.42 1321.52 1272.50 216.65 857.28 826.00 114.22 2007 2.92 2.80 0.46 1436.36 1385.60 242.58 931.12 903.30 127.84 2008 3.09 2.96 0.47 1520.58 1446.65 245.22 990.15 952.40 132.74 2009 3.14 3.07 0.47 1544.85 1509.20 246.67 1001.10 983.90 133.02 2010 3.53 3.33 0.57 1727.29 1629.30 298.74 1137.28 1080.70 164.08 2011 3.66 3.53 0.53 1794.48 1740.90 283.99 1174.52 1139.00 149.32 2012 3.68 3.59 0.55 1821.17 1772.10 291.65 1171.92 1138.35 154.95 2013 3.85 3.59 0.72 1894.93 1774.40 376.32 1220.78 1141.00 207.40 2014 3.73 3.67 0.50 1820.76 1789.90 269.92 1183.28 1168.70 136.23 2015 3.83 3.74 0.55 1877.14 1832.70 295.01 1219.60 1196.00 149.15 2016 4.03 3.84 0.71 1977.62 1877.05 378.35 1290.49 1227.35 202.47 2017 4.18 3.98 0.88 2037.56 1945.70 453.69 1337.44 1275.00 264.59 数据来源:笔者依据上海市电力公司用电负荷数据整理所得。  下载: 导出CSV
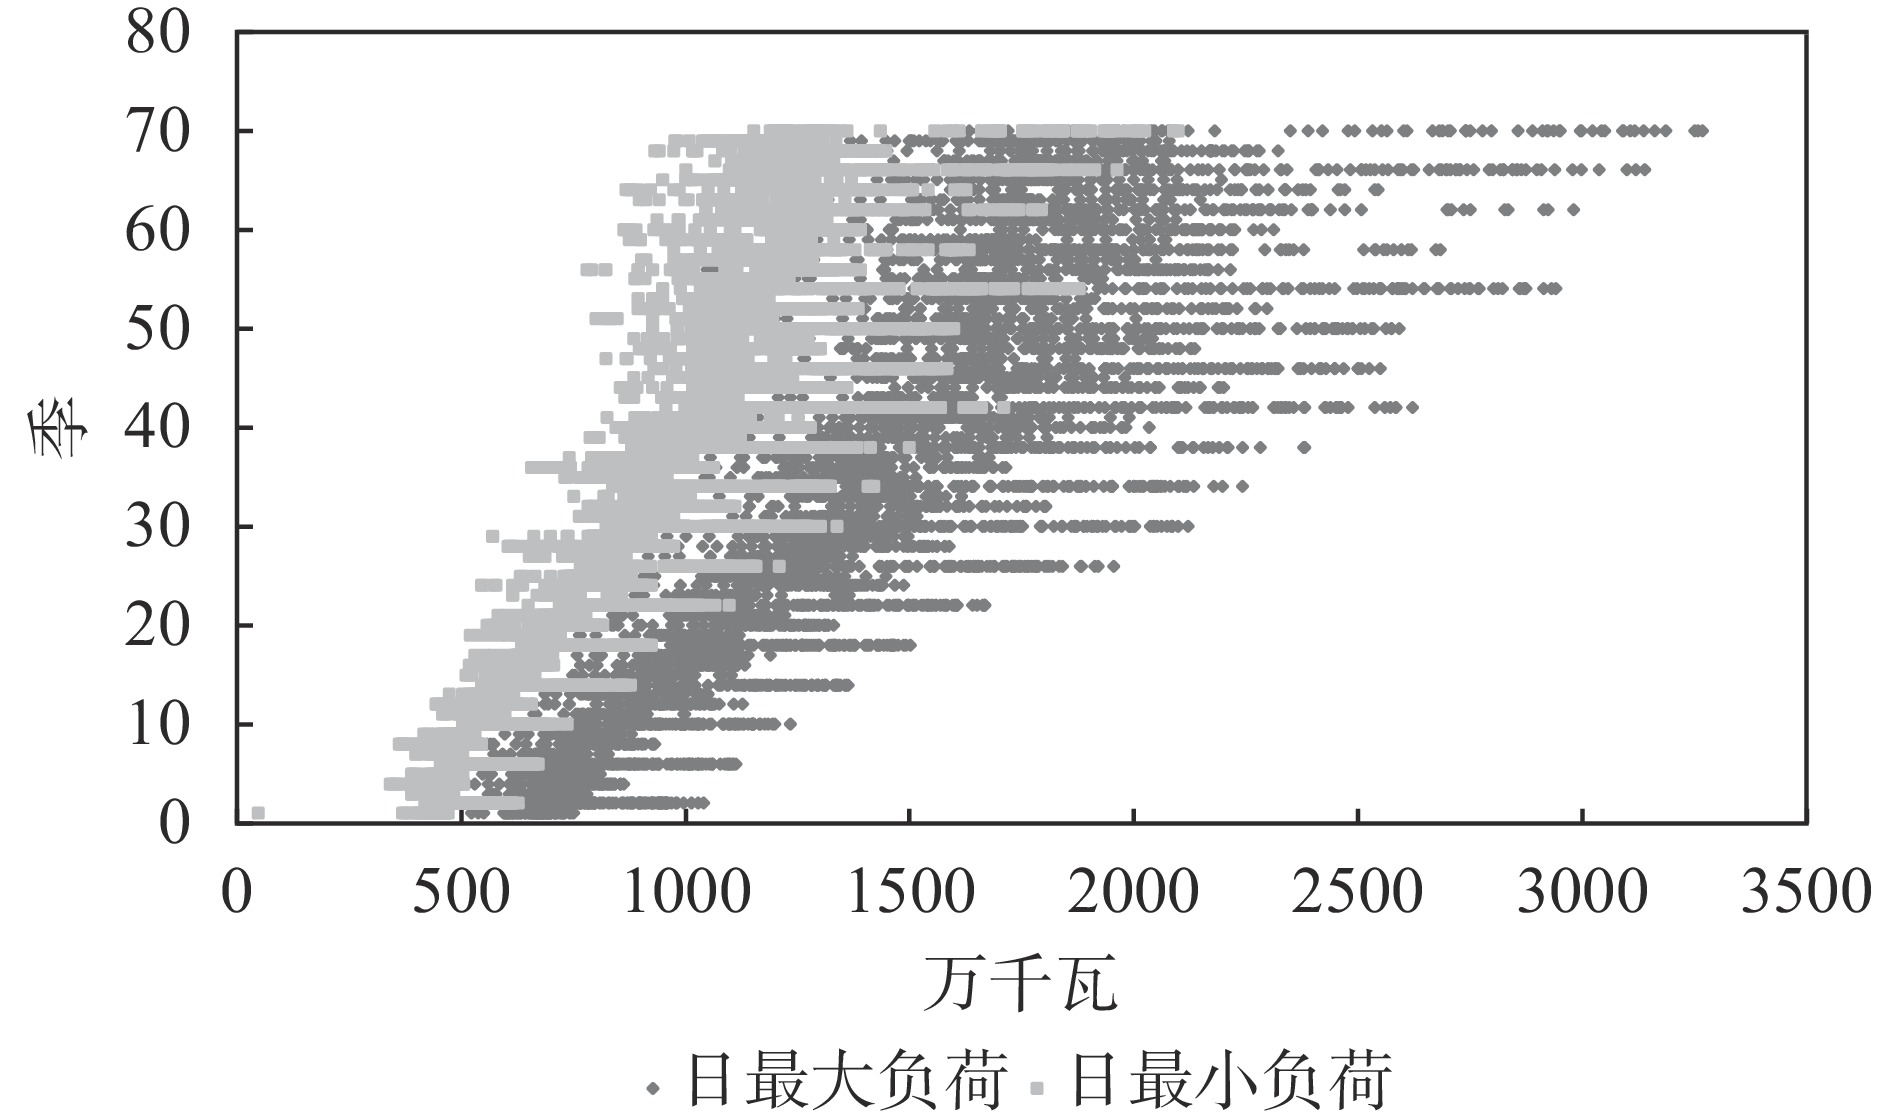
表 2 日温度数据的描述性统计
温度数据 日最高温度(摄氏度) 日最低温度(摄氏度) 年份 平均数 中位数 标准差 平均数 中位数 标准差 全样本 21.59 22.70 9.32 15.06 15.8 8.74 2000 23.56 24.60 7.76 17.11 18.00 7.41 2001 21.37 23.00 9.10 14.89 15.50 8.51 2002 21.66 21.60 8.53 15.04 15.60 7.91 2003 21.55 22.50 9.85 14.79 15.00 9.07 2004 21.96 23.15 9.07 15.12 15.65 8.62 2005 21.58 23.20 10.26 14.65 16.10 9.61 2006 22.17 23.40 9.37 15.55 16.20 8.65 2007 22.27 22.40 8.98 15.68 15.30 8.33 2008 21.38 22.20 9.69 14.65 15.00 9.15 2009 21.55 24.20 9.49 14.92 16.70 8.90 2010 21.23 21.00 9.49 14.64 14.10 9.07 2011 21.00 22.00 9.83 14.43 16.00 9.28 2012 20.63 22.45 9.74 14.54 15.80 8.97 2013 21.81 22.40 9.99 15.08 15.20 9.33 2014 20.84 21.90 8.33 14.85 15.80 8.08 2015 20.95 23.20 8.54 14.80 16.00 8.00 2016 21.48 22.10 9.26 15.46 16.05 8.72 2017 22.30 22.90 10.01 15.37 16.30 9.14 数据来源:笔者依据上海市电力公司温度数据整理所得。
下载: 导出CSV
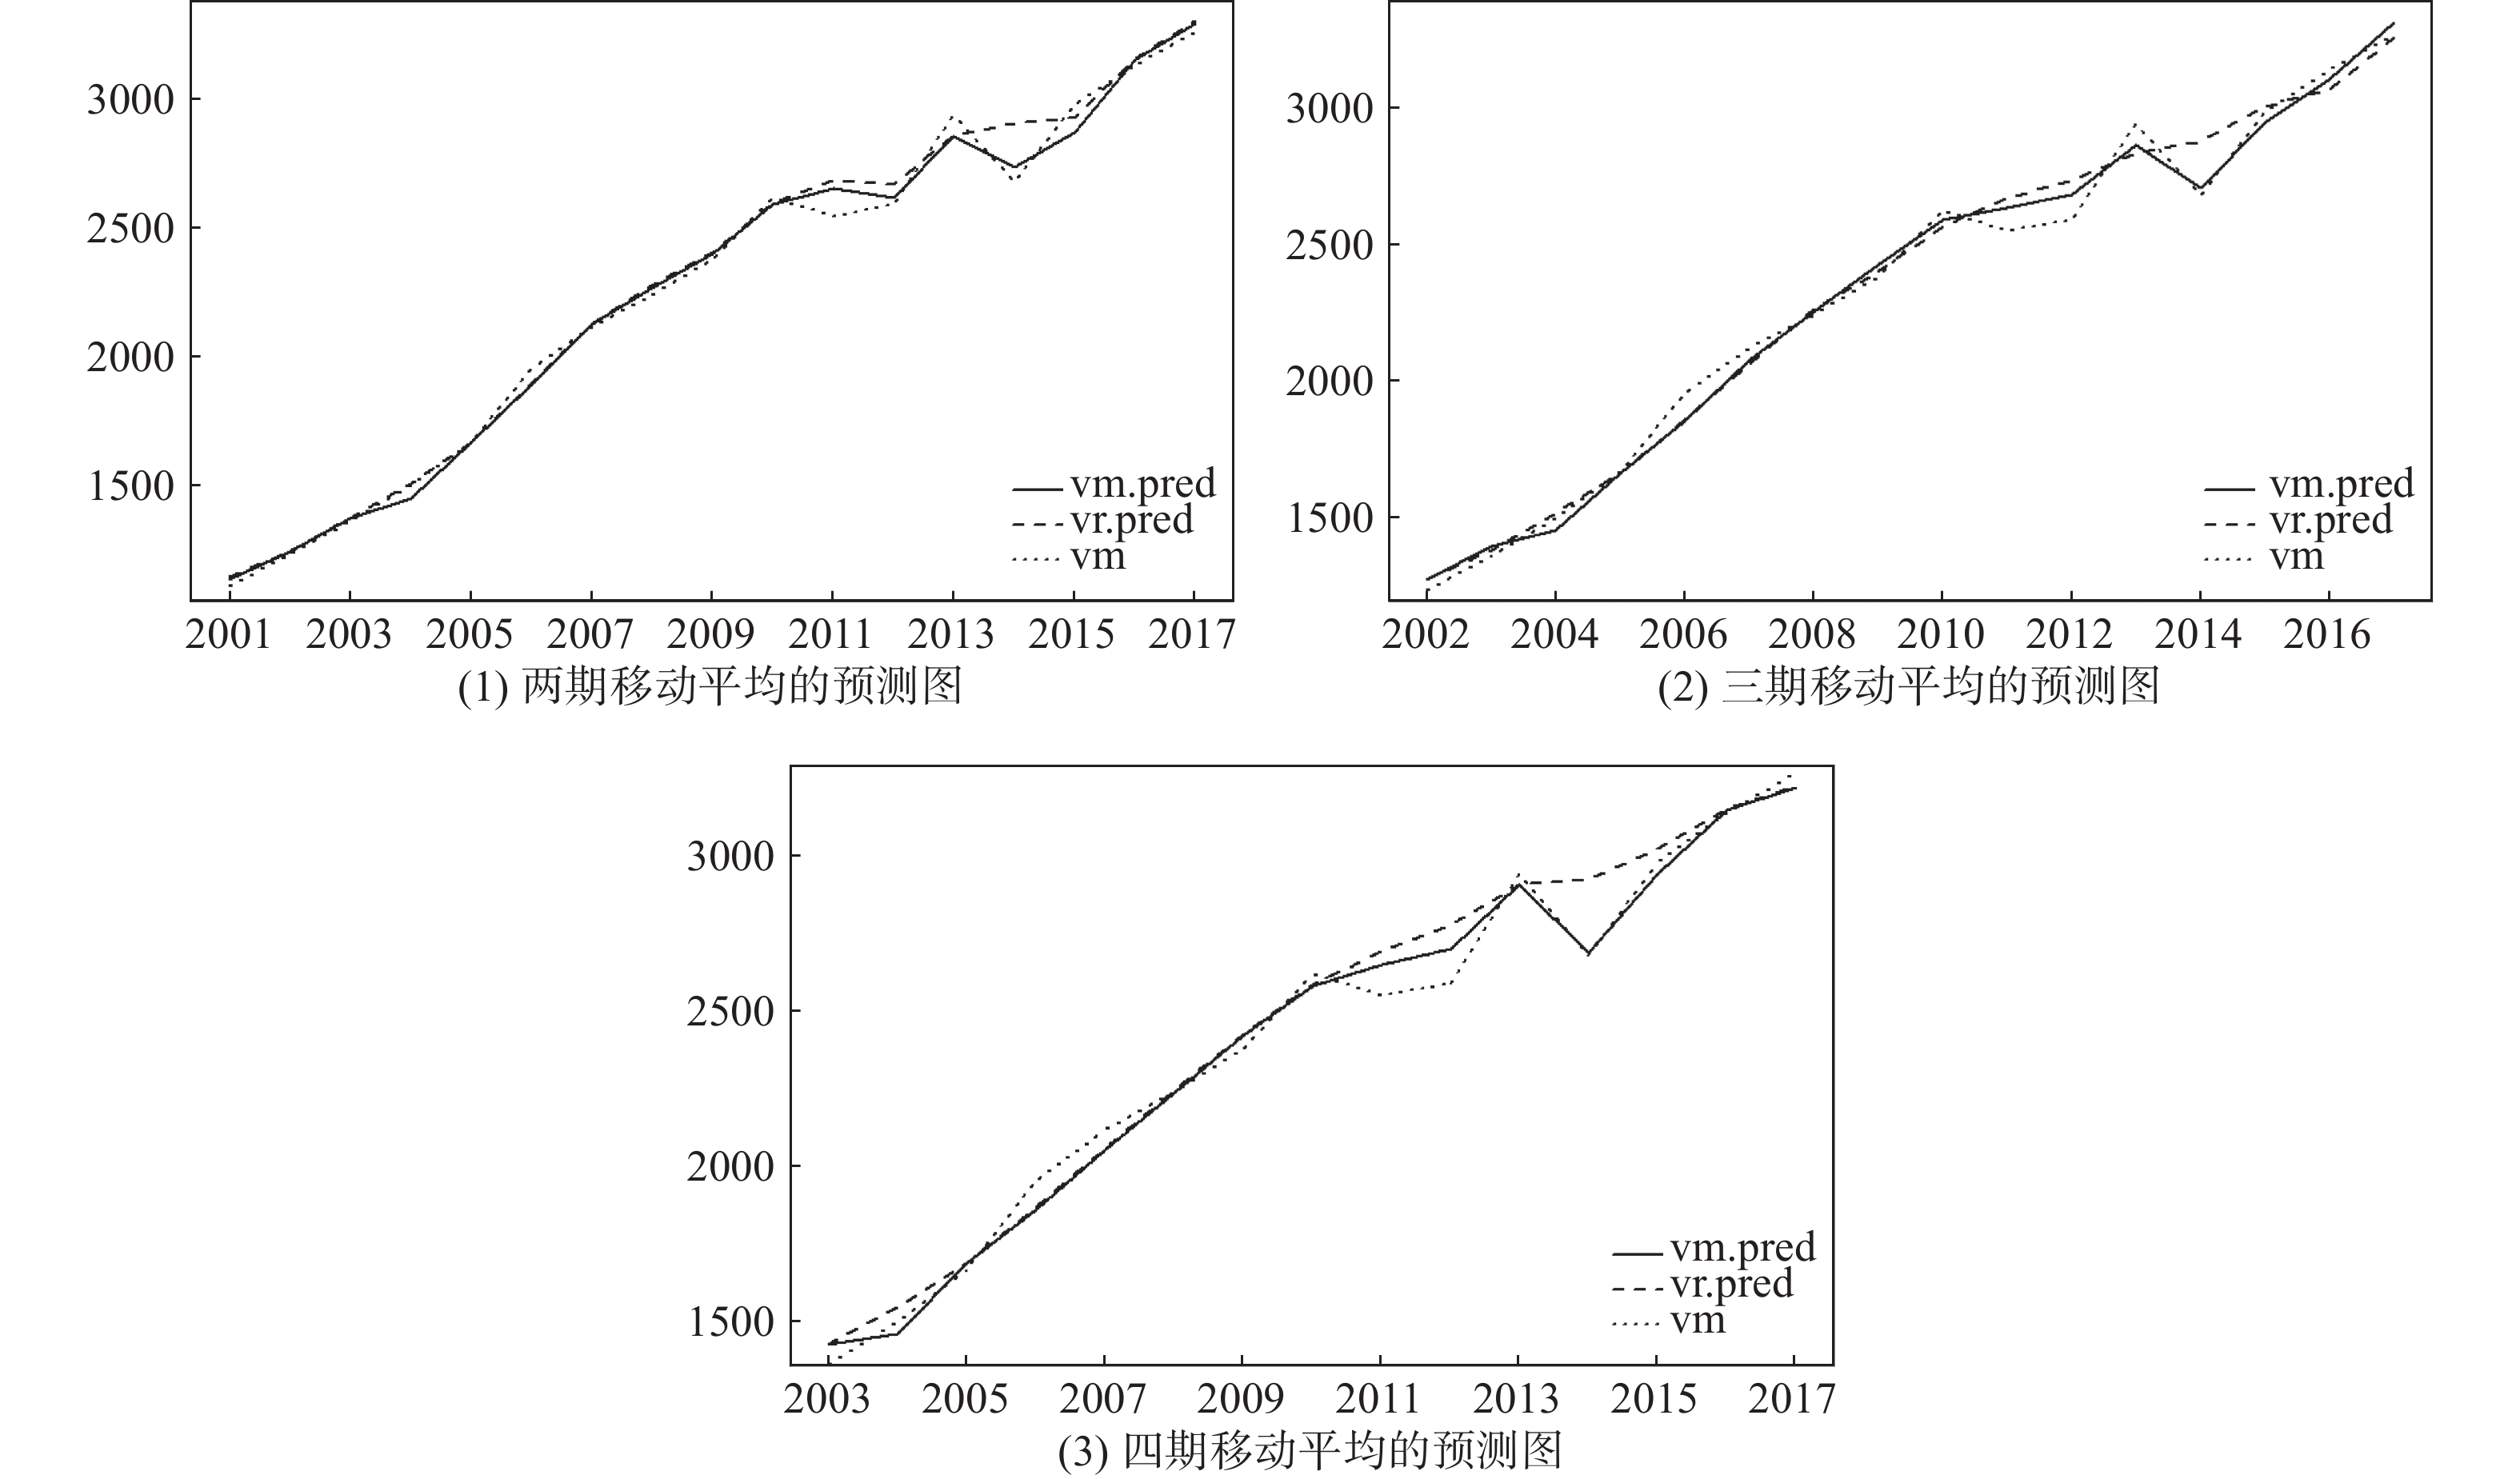
表 3 最大用电负荷估计和预测模型
两期移动平均的估计值 三期移动平均的估计值 四期移动平均的估计值 α 0.2553[0.1504] 0.6860***[0.1872] 1.1076***[0.2166] γ 1.0067***[0.0210] 1.0022***[0.0274] 1.0072***[0.0334] K11 −0.0015 [0.0112] 0.0077[0.0130] −0.0008[0.0143] K12 0.0287**[0.0128] 0.0293*[0.0150] 0.0399**[0.0166] 调整的R2 0.9948 0.9911 0.9865 p-value 1.151e-15 3.926e-13 3.915e-11 注:* 表示90%水平显著,**表示95%水平显著,***表示99%水平显著。
下载: 导出CSV
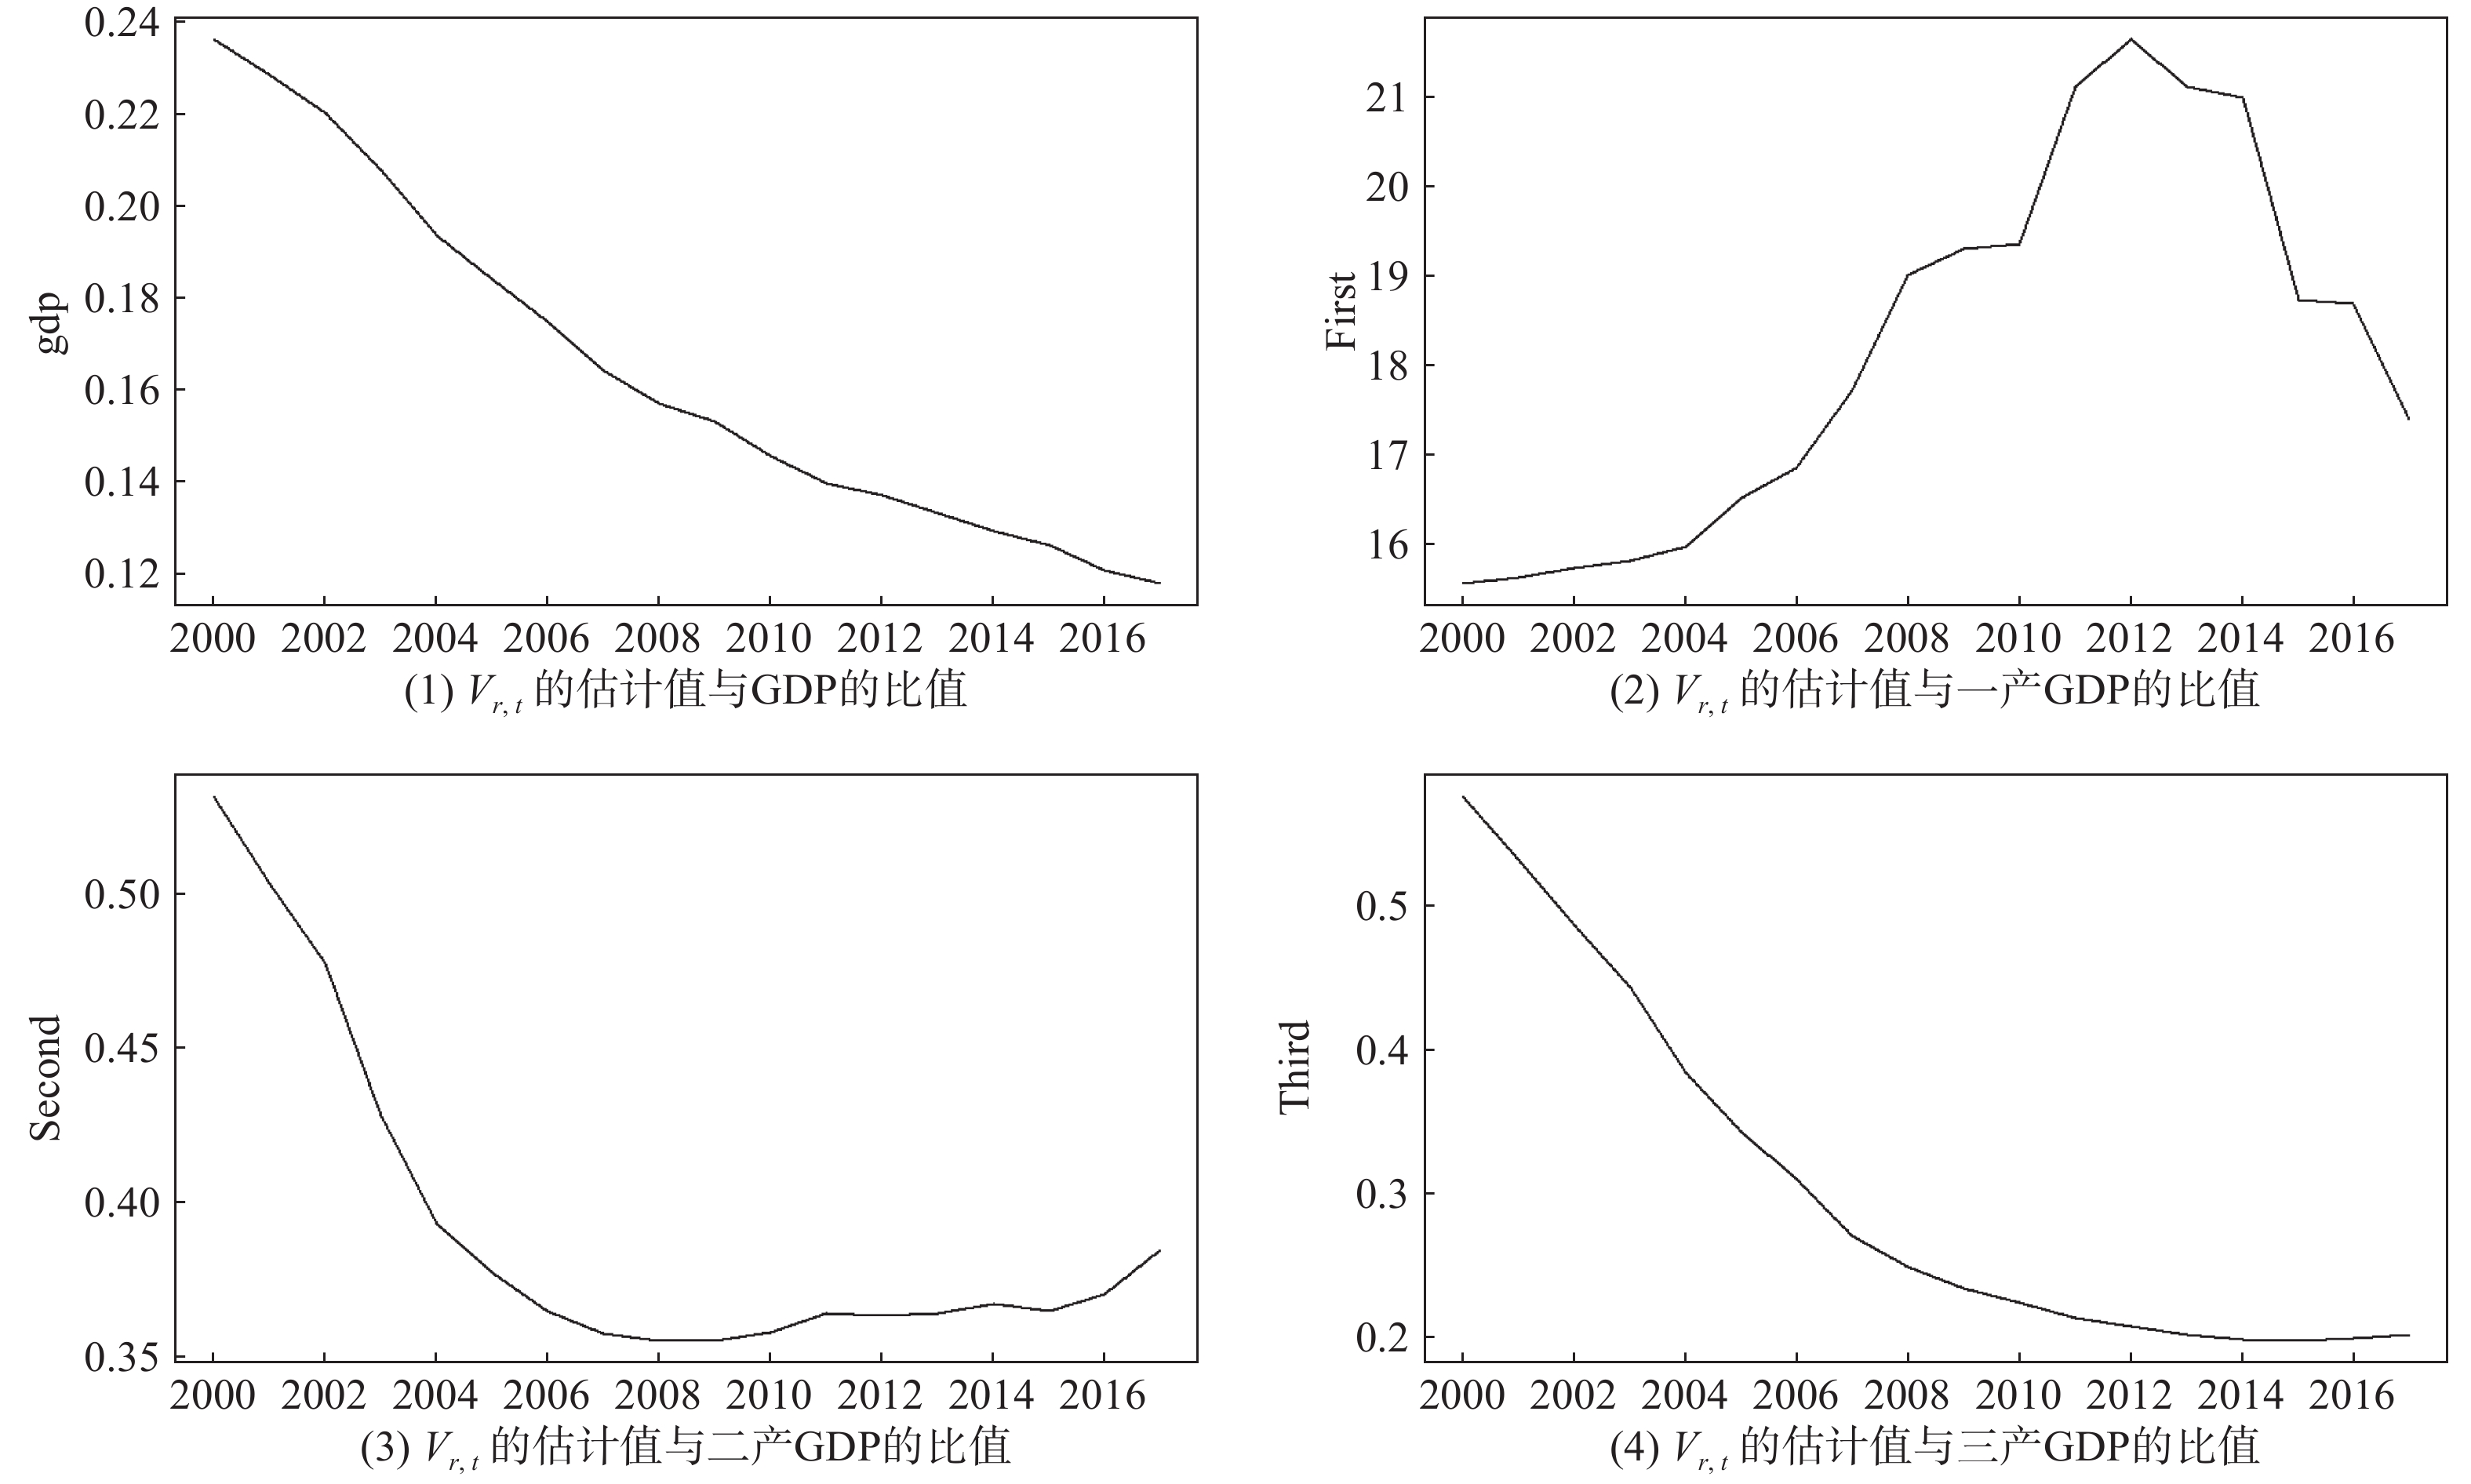
表 5 最大基准用电负荷指数与经济变量的关系
GDP 一产GDP 二产GDP 三产GDP 估计值 0.7662***[0.0774] 0.3819***[0.1113] 0.7057***[0.0853] 0.7794***[0.0754] 调整的 R2 0.5810 0.1335 0.4908 0.6018 p-value 6.953e-15 0.0010 6.291e-12 1.18e-15 注:* 表示90%水平显著,**表示95%水平显著,***表示99%水平显著。
下载: 导出CSV
-

 下载:
下载:


 点击查看大图

图(10)表(5)
计量
- 文章访问数: 4582
- HTML全文浏览量: 440
 沪公网安备 31010102003103号