
控制人口能缓解城市通勤问题吗—基于人群异质性通勤模式的比较分析
Limiting Urban Population Scale Matters on Relieving Congestion
-
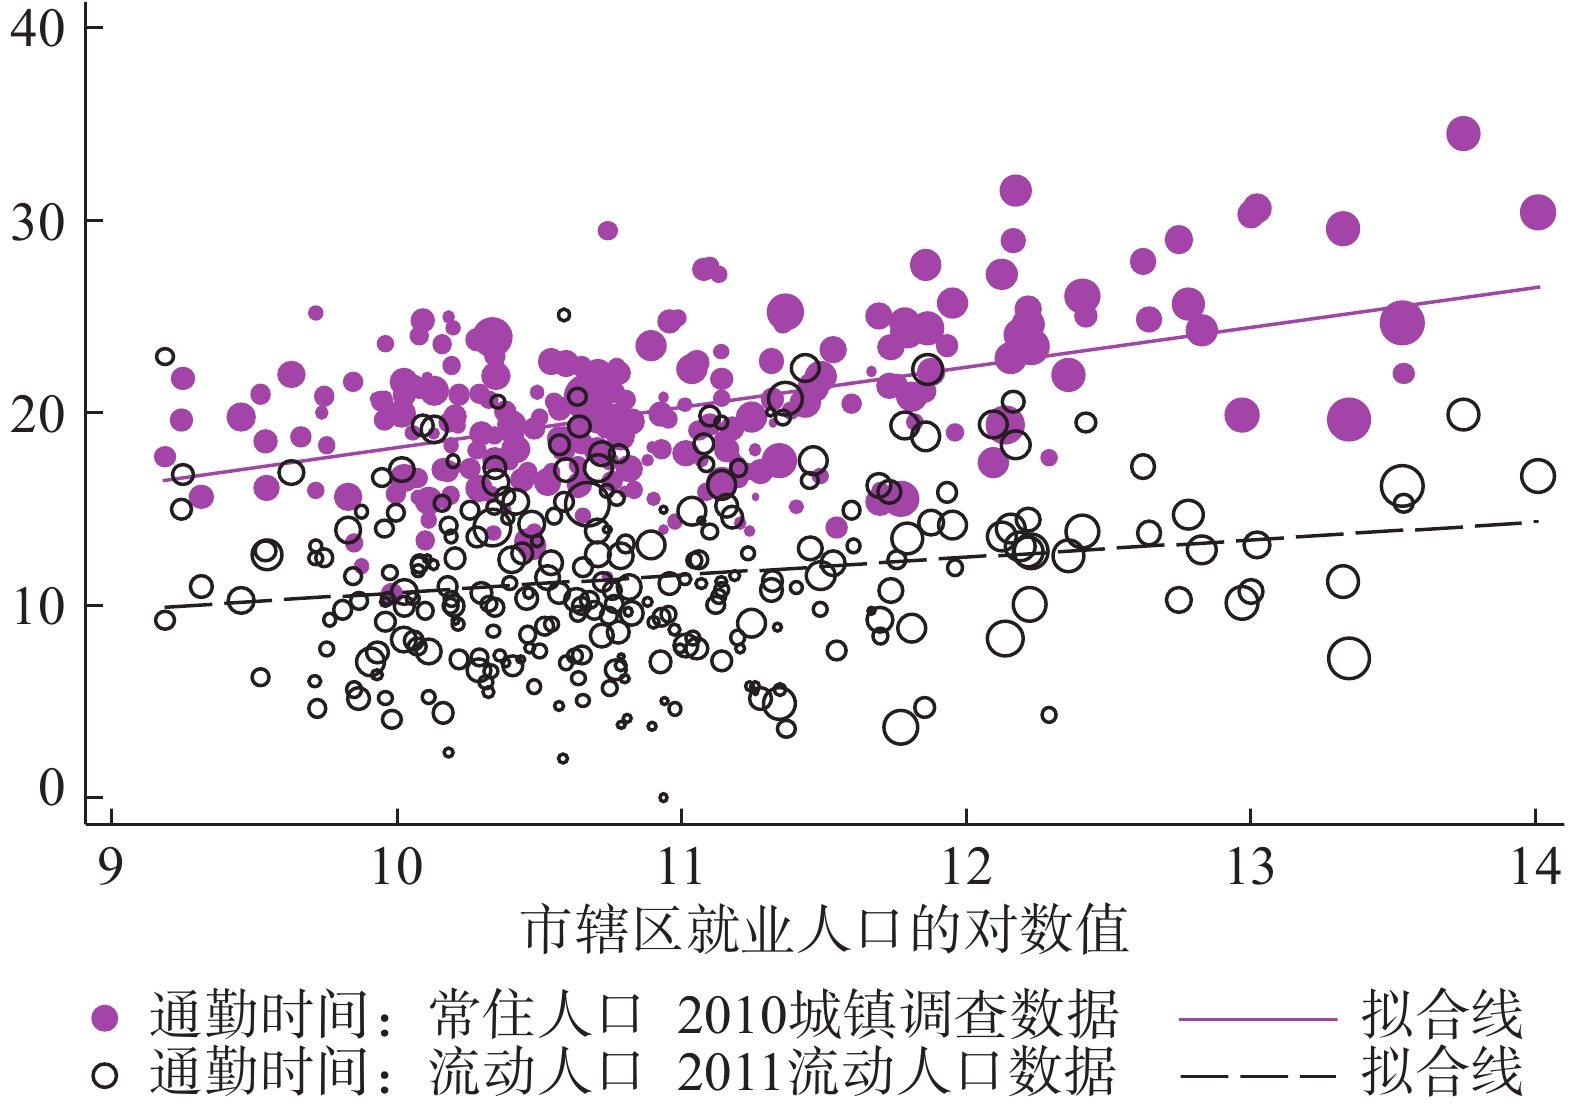
摘要: 本文利用“2011年全国流动人口动态监测调查数据”和“2010年全国城镇住户基本情况抽样调查数据”,对比分析了中国城市流动人口和常住人口的通勤特征。研究发现,流动人口的平均通勤时间远低于常住人口;并且随着城市人口规模增加,其通勤时间增加的速度慢于常住人口。因此,平均来看流动人口对城市平均通勤时间没有显著的影响。进一步的分析发现,在从事职业方面,有较高比例的流动人口从事经商、商贩、餐饮等商业服务业,这些职业从业人员通勤时间短,且通勤时间对城市人口规模变化并不敏感;在居住类型方面,流动人口中有很高比例的人通过租房或者雇主提供的住房解决居住问题,他们通勤时间较短,并且通勤时间不随城市人口规模增加而发生较大变化。因此流动人口呈现出短距离通勤比例较高的特征。根据本文的研究结果,治理城市拥堵时,须慎重采取简单控制人口规模的方式。Abstract: This paper analyzed migrant population’s commuting characteristics, using the data of China Migrants Dynamic Survey 2011, and compared them with resident population. We found migrant population’s average commuting time was much lower than that of resident population, and as urban population increased, average commuting time of migrant population increased more slowly than the resident population, so when we controlled the numbers of resident population, the numbers of migrant population didn’t influence the cities’ average commuting time significantly. The main reason of these was there was a large proportion of migrant population commuted in short distance, which could be explained by migrant population’s characteristics of occupation and residence: firstly, a high proportion of migrant population was engaged in business services such as business, traders, restaurants, etc., and their commuting time was short on average and increased slowly when urban population increased; secondly, a high percentage of migrant population lived in rented houses or houses provided by employer, and their commuting time were also shorter than the people lived in houses purchased or built by themselves, and increased slowly when urban population increased. According to the research of this paper, we can’t relieve congestion through limiting urban population scale.
-
表 1 城市人口规模与通勤时间的关系⑫
变量 (1)时间 (2)时间全市2011流动 (3)时间市辖区2011流动 (4)时间 (5)时间 (6)时间 (7)时间 就业人口 2.084***
(0.293)0.915***
(0.292)0.631**
(0.304)0.357
(0.476)0.846**
(0.394)流动人口
(本省+外省)0.511
(0.376)0.126
(0.382)流动人口
(外省)0.002
(0.244)−0.126
(0.227)常住人口 1.056*
(0.537)1.322***
(0.416)控制变量 是 是 是 是 是 是 是 观测值 244 266 239 239 239 239 239 R2 0.221 0.032 0.014 0.38 0.39 0.375 0.39 注:括号中的值为异方差稳健标准误;*** p<0.01,** p<0.05,* p<0.1。解释变量“就业人口”和“常住人口”分别为2010年人口普查中城市就业人口和常住人口的对数值,代表城市人口规模。为了节省篇幅,本文未报告控制变量(面积、人均GDP和省会直辖市)和常数项的回归系数①。除了“省会直辖市”之外,解释变量都进行了对数化处理。  下载: 导出CSV
表 2 不同通勤方式的比例与时间(分钟)⑭
上班交通工具 步行 自行车 自驾车 公交车 地铁 出租车 单位班车 其他 2010城镇调查 通勤比例 0.301 0.247 0.117 0.141 0.043 0.007 0.065 0.123 通勤时间 12.11 19.73 19.51 31.40 46.60 18.08 32.44 21.39 上班交通工具 步行 自行车 自驾机动车 公共交通 班车 不使用 2011流动人口 通勤比例 0.355 0.194 0.118 0.1 0.02 0.214 通勤时间 10.03 19.18 20.53 34.12 27.16 0 市辖区 通勤比例 0.353 0.199 0.113 0.118 0.018 0.2 通勤时间 10.30 20.02 21.64 34.72 29.17 0
下载: 导出CSV
表 3 各职业人口比例
主要职业 2010普查 2010普查市辖区 流动人口 流动人口通勤
时间为0流动人口市辖区 流动人口市辖区通勤
时间为0商业服务业 16.58 25.64 14.06 12.11 15.45 13.17 经商 17.58 29.1 17.64 29.42 商贩 6.04 8.32 6.7 9.32 餐饮 11.1 12.9 11.95 13.65 家政 0.48 0.38 0.54 0.41 保洁 1.34 0.65 1.5 0.67 保安 0.96 0.45 1.05 0.46 装修 3.31 1.86 3.52 1.97 注:“商业服务业”代表“商业、服务业人员”,在2011年流动人口监测数据中,这指除了“经商”“商贩”等职业之外的其他商业、服务业人员。
下载: 导出CSV
表 4 流动人口各职业通勤时间对比及不同人口规模城市通勤时间的变化
变量 (1)通勤时间全市 (2)通勤时间市辖区 (3)时间变化全市 (4)时间变化市辖区 国家机关 5.478***(1.185) 5.571***(1.452) 3.432***(0.930) 3.533***(1.151) 专业技术人员 2.349***(0.178) 2.256***(0.216) 办事人员 3.285***(0.404) 3.413***(0.464) 2.322***(0.318) 2.604***(0.357) 商业、服务业人员 −2.570***(0.229) −3.048***(0.276) 1.296***(0.112) 0.915***(0.126) 经商 −7.283***(0.216) −8.038***(0.266) 0.832***(0.079) 0.461***(0.094) 商贩 −6.366***(0.259) −7.465***(0.3) 0.166(0.157) −0.071(0.167) 餐饮 −6.237***(0.223) −6.986***(0.271) 0.572***(0.0984) 0.204*(0.112) 家政 1.726**(0.779) 1.196(0.803) 0.733(0.614) 0.529(0.593) 保洁 −0.986**(0.417) −1.811***(0.469) 0.621**(0.311) 0.189(0.338) 保安 −2.017***(0.466) −2.833***(0.529) −0.273(0.378) −0.661(0.427) 装修 8.407***(0.42) 8.659***(0.49) 4.749***(0.408) 4.591***(0.464) 农林牧渔 −6.073***(0.501) −8.287***(0.591) −1.714***(0.444) 0.120(0.354) 生产、运输操作 −2.107***(0.252) −2.055***(0.329) 0.989***(0.158) 0.253(0.211) 生产 −4.603***(0.218) −5.160***(0.278) 0.737***(0.094) 0.189(0.126) 运输 −1.441***(0.352) −2.035***(0.408) 0.643**(0.262) 0.002(0.304) 建筑 3.289***(0.318) 3.099***(0.39) 0.487**(0.239) −0.241(0.289) 无固定职业 2.233***(0.419) 1.249***(0.484) 0.387(0.373) 0.164(0.432) 不便分类 −3.157***(0.321) −4.383***(0.383) 0.967***(0.238) 1.098***(0.276) 常数项 16.56***(0.984) 18.89***(2.686) 城市固定效应 是 是 观测值 95,069 74,119 R2 0.138 0.136 注:括号中的值为异方差稳健标准误;*** p<0.01,** p<0.05,* p<0.1。为了节省表格空间,有些职业进行了缩写,其中,“国家机关”代表“国家机关、党群组织、企事业单位负责人”,“办事人员”代表“办事人员和有关人员”,“农林牧渔”代表“农、林、牧、渔、水利业生产人员”,“生产、运输操作”代表“生产、运输设备操作人员及有关人员”,“不便分类”代表“其他不便分类的从业人员”。(1)(2)列的解释变量均为0—1变量。
下载: 导出CSV
表 5 流动人口居住情况与全国平均水平的对比
全国统计 流动人口 住房类型 比例 现住房是何种性质 比例 市辖区比例 租赁 廉租住房 25.77 2.66 租住单位/雇主房 70.45 5.16 72.25 5.07 其他住房 23.11 租住私房 65.1 66.99 自建住房 69.78 16.43 政府提供廉租房 0.2 0.19 购买 商品房 26.02 自购房/自建房 11.81 11.81 11.78 11.78 二手房 4.98 借住房 17.38 1.78 15.6 1.87 经济适用房 5.05 单位/雇主提供免费住房 11.78 9.93 原公有住房 17.3 就业场所 3.82 3.80 其他 4.46 4.46 其他非正规居所 0.36 0.36 0.37 0.37 总计 100 100 总计 100 100 100 100 注:全国的数据由“2010年人口普查数据”计算而来,流动人口的数据由“2011年流动人口监测数据”计算而来。
下载: 导出CSV
表 6 各种居住方式的流动人口通勤时间对比及不同人口规模城市通勤时间的变化
变量 (1)通勤时间全市 (2)通勤时间市辖区 (3)时间变化全市 (4)时间变化市辖区 租住单位/雇主房 −8.856***(0.261) −9.0***(0.311) 0.625***(0.154) 0.34*(0.182) 租住私房 −5.269***(0.200) −5.498***(0.232) 1.072***(0.055) 0.708***(0.063) 政府提供廉租房 −0.885(1.471) 0.861(1.868) 5.12***(1.104) 4.823***(1.338) 借住房 −2.564***(0.477) −2.591***(0.55) 1.748***(0.354) 2.003***(0.396) 单位/雇主提供免费住房 −13.23***(0.209) −13.75***(0.246) 0.449***(0.063) 0.213**(0.083) 自购房/自建房 2.664***(0.173) 2.922***(0.202) 就业场所 −18.33***(0.205) −19.16***(0.24) −0.071(0.063) −0.156**(0.078) 其他非正规居所 −11.73***(0.839) −12.47***(0.908) −0.128(0.514) 0.129(0.531) 常数项 21.16***(0.894) 24.88***(2.527) 城市固定效应 是 是 观测值 95069 74119 R2 0.151 0.140 注:括号中的值为异方差稳健标准误;*** p<0.01,** p<0.05,* p<0.1。(1)(2)列的解释变量均为0−1变量。
下载: 导出CSV
-

 下载:
下载:

 点击查看大图
图(1)表(6)
计量
- 文章访问数: 4087
- HTML全文浏览量: 347
 沪公网安备 31010102003103号