
中国城市职业多样性:事实、演进与政策含义
Measurement, Trends and Policy Implications of Urban Occupational Diversity in China
-
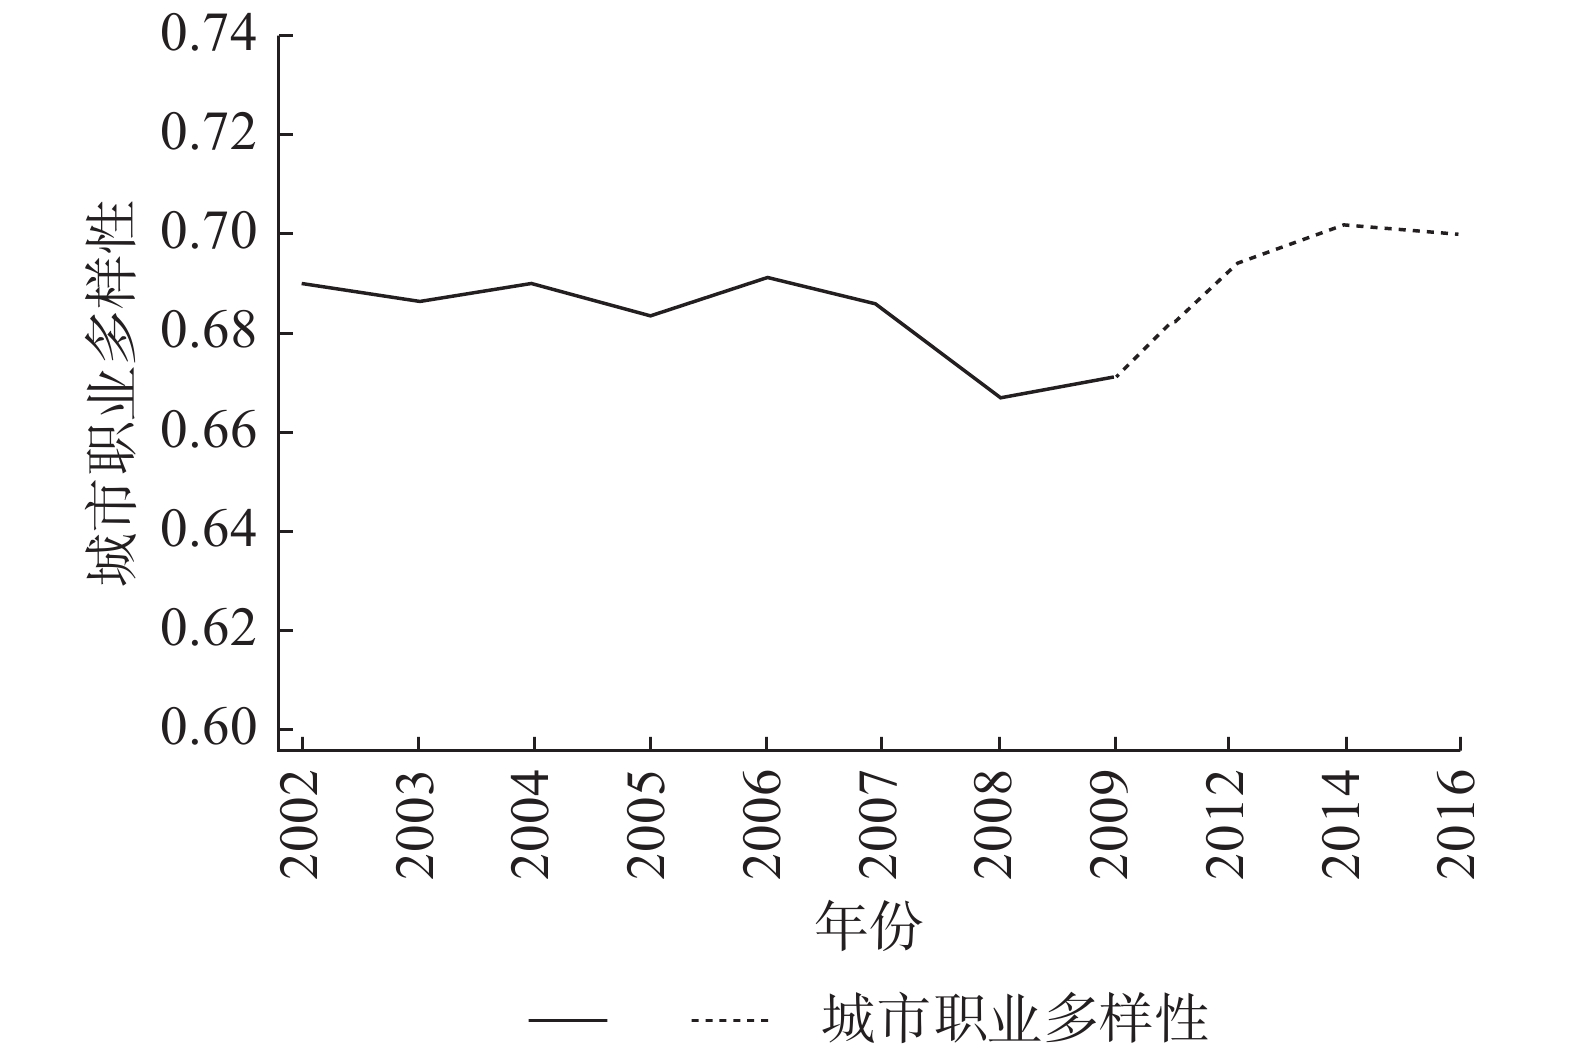
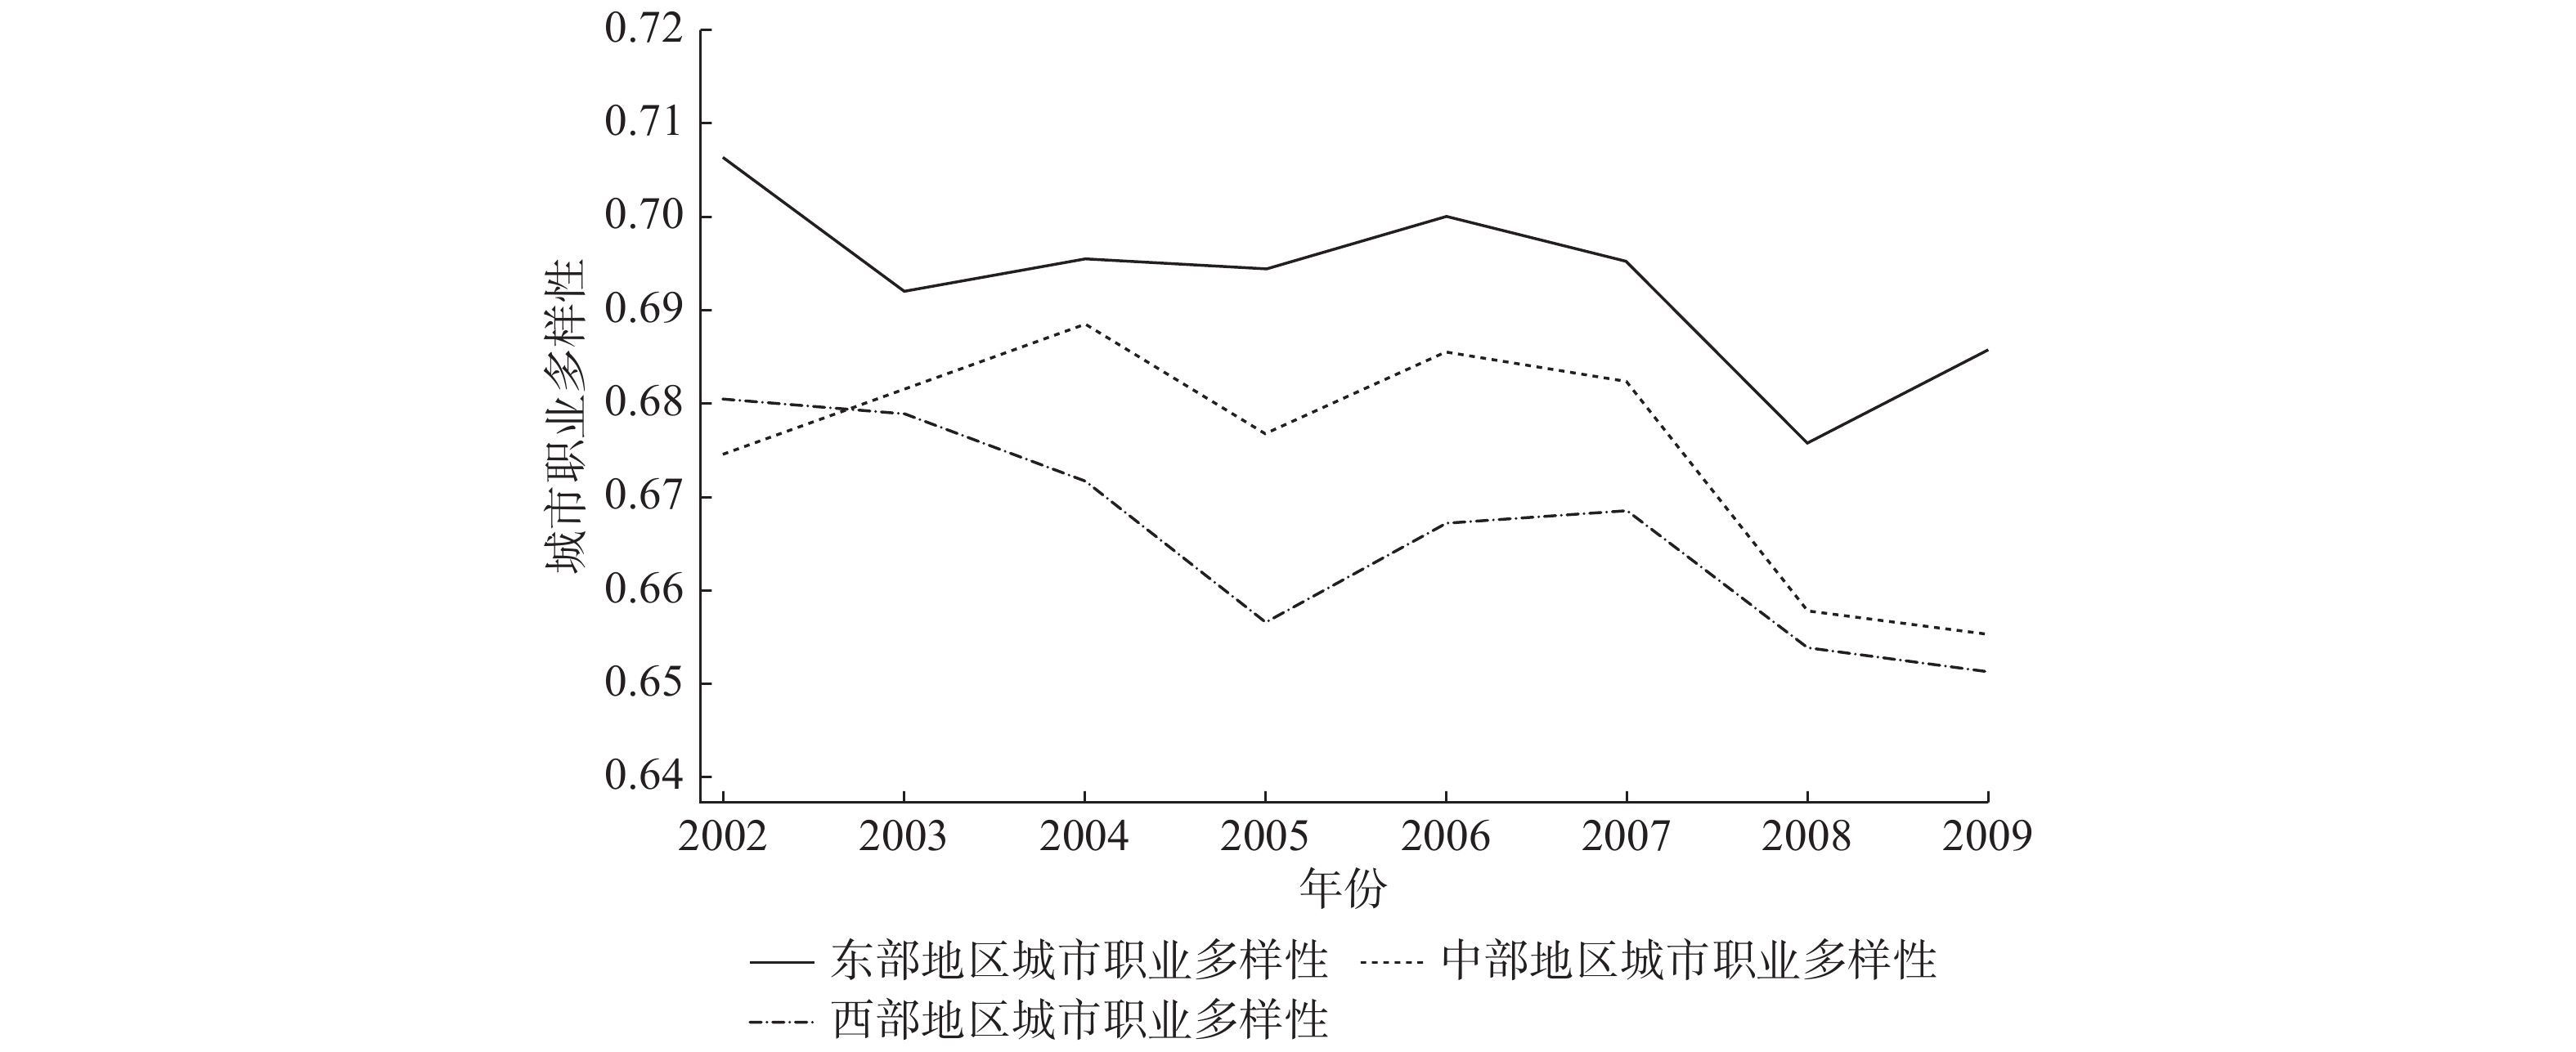
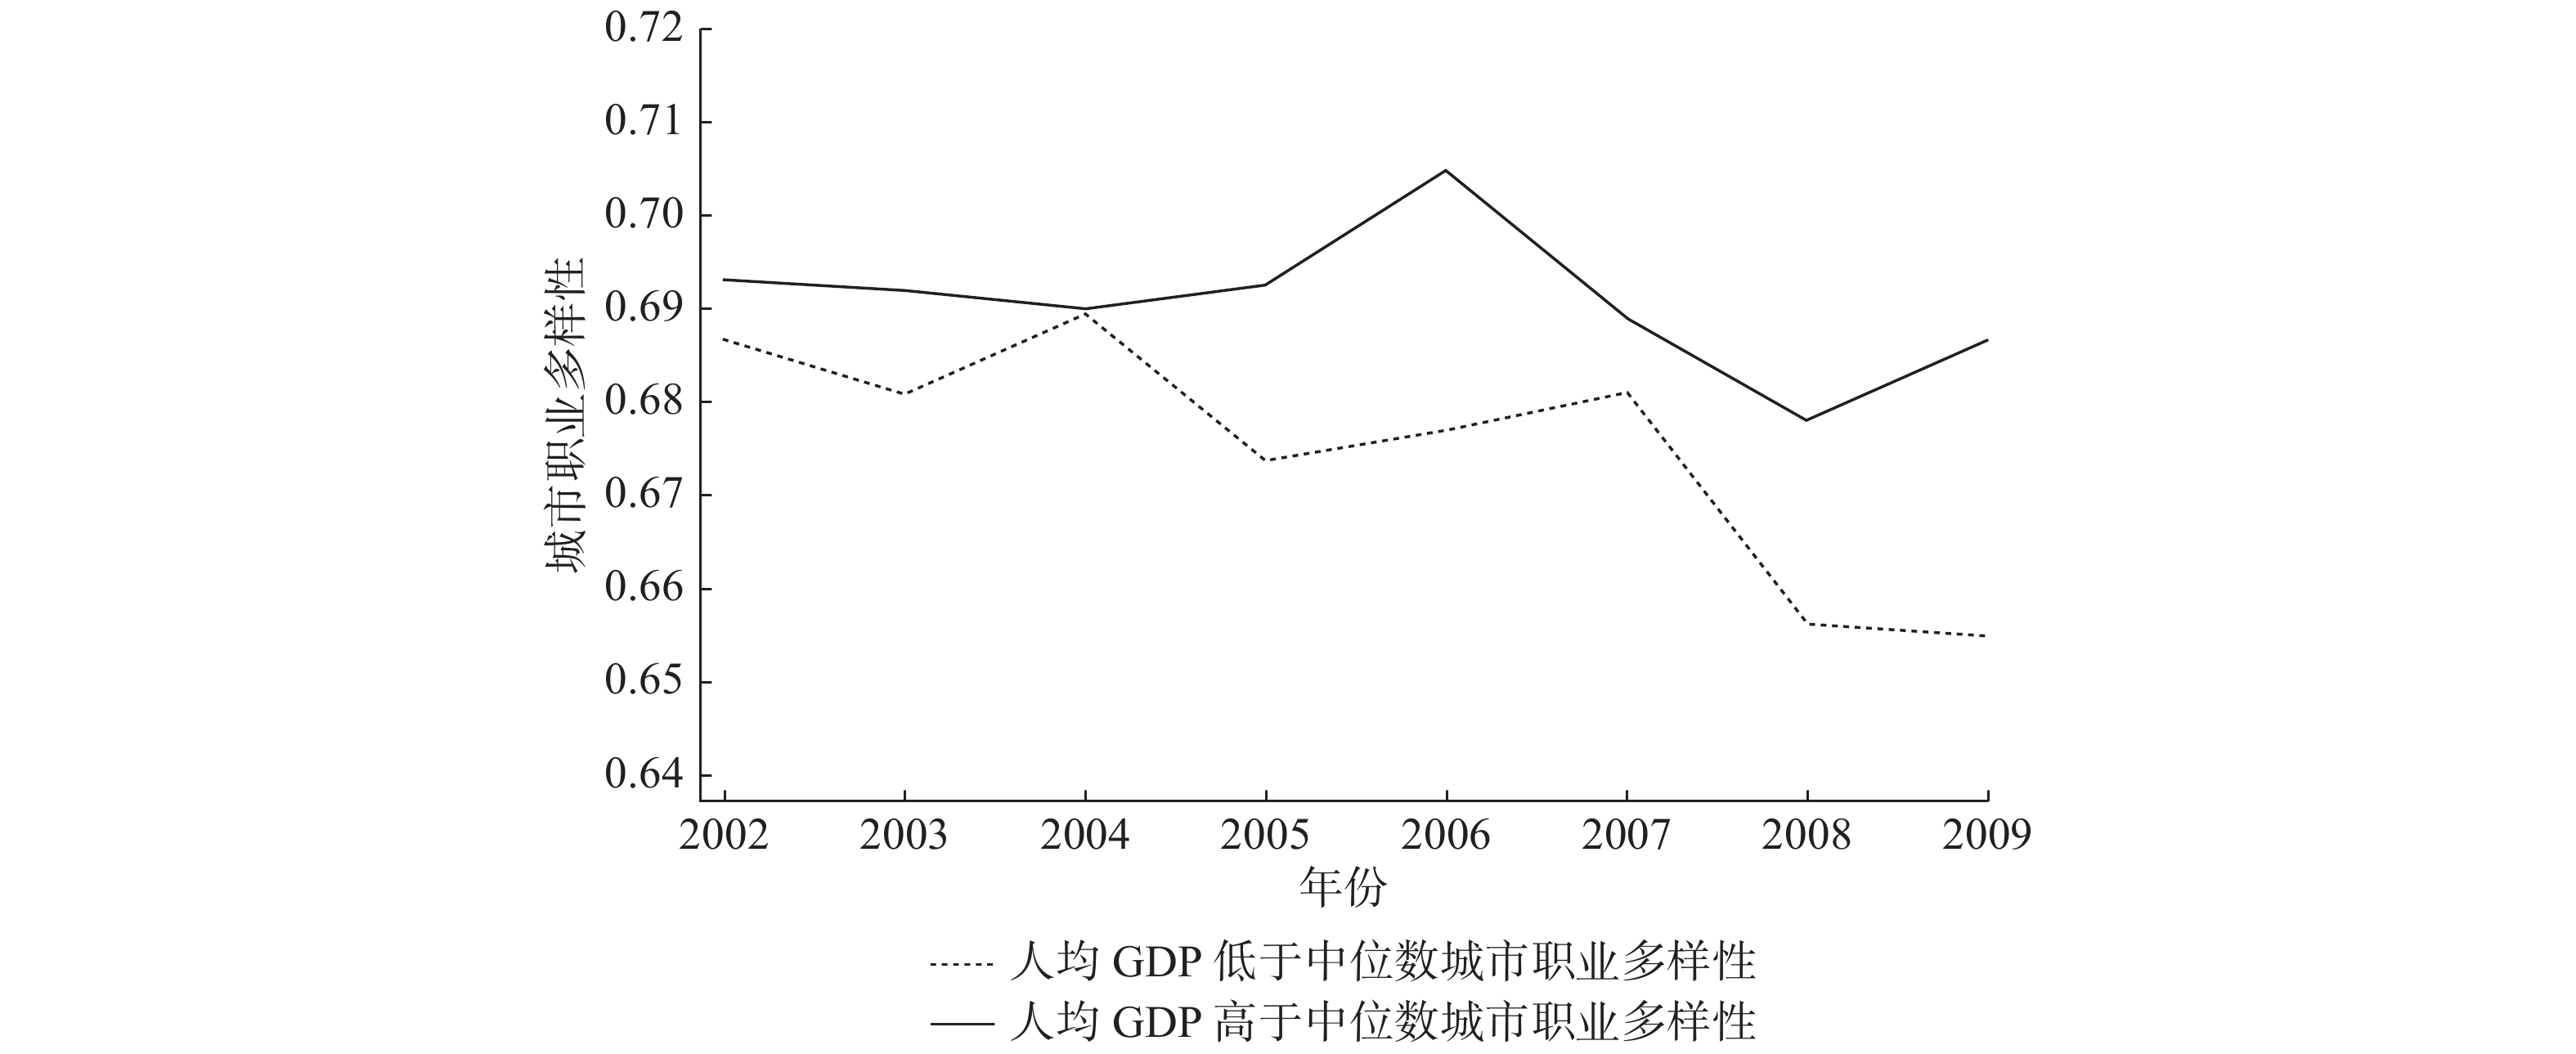
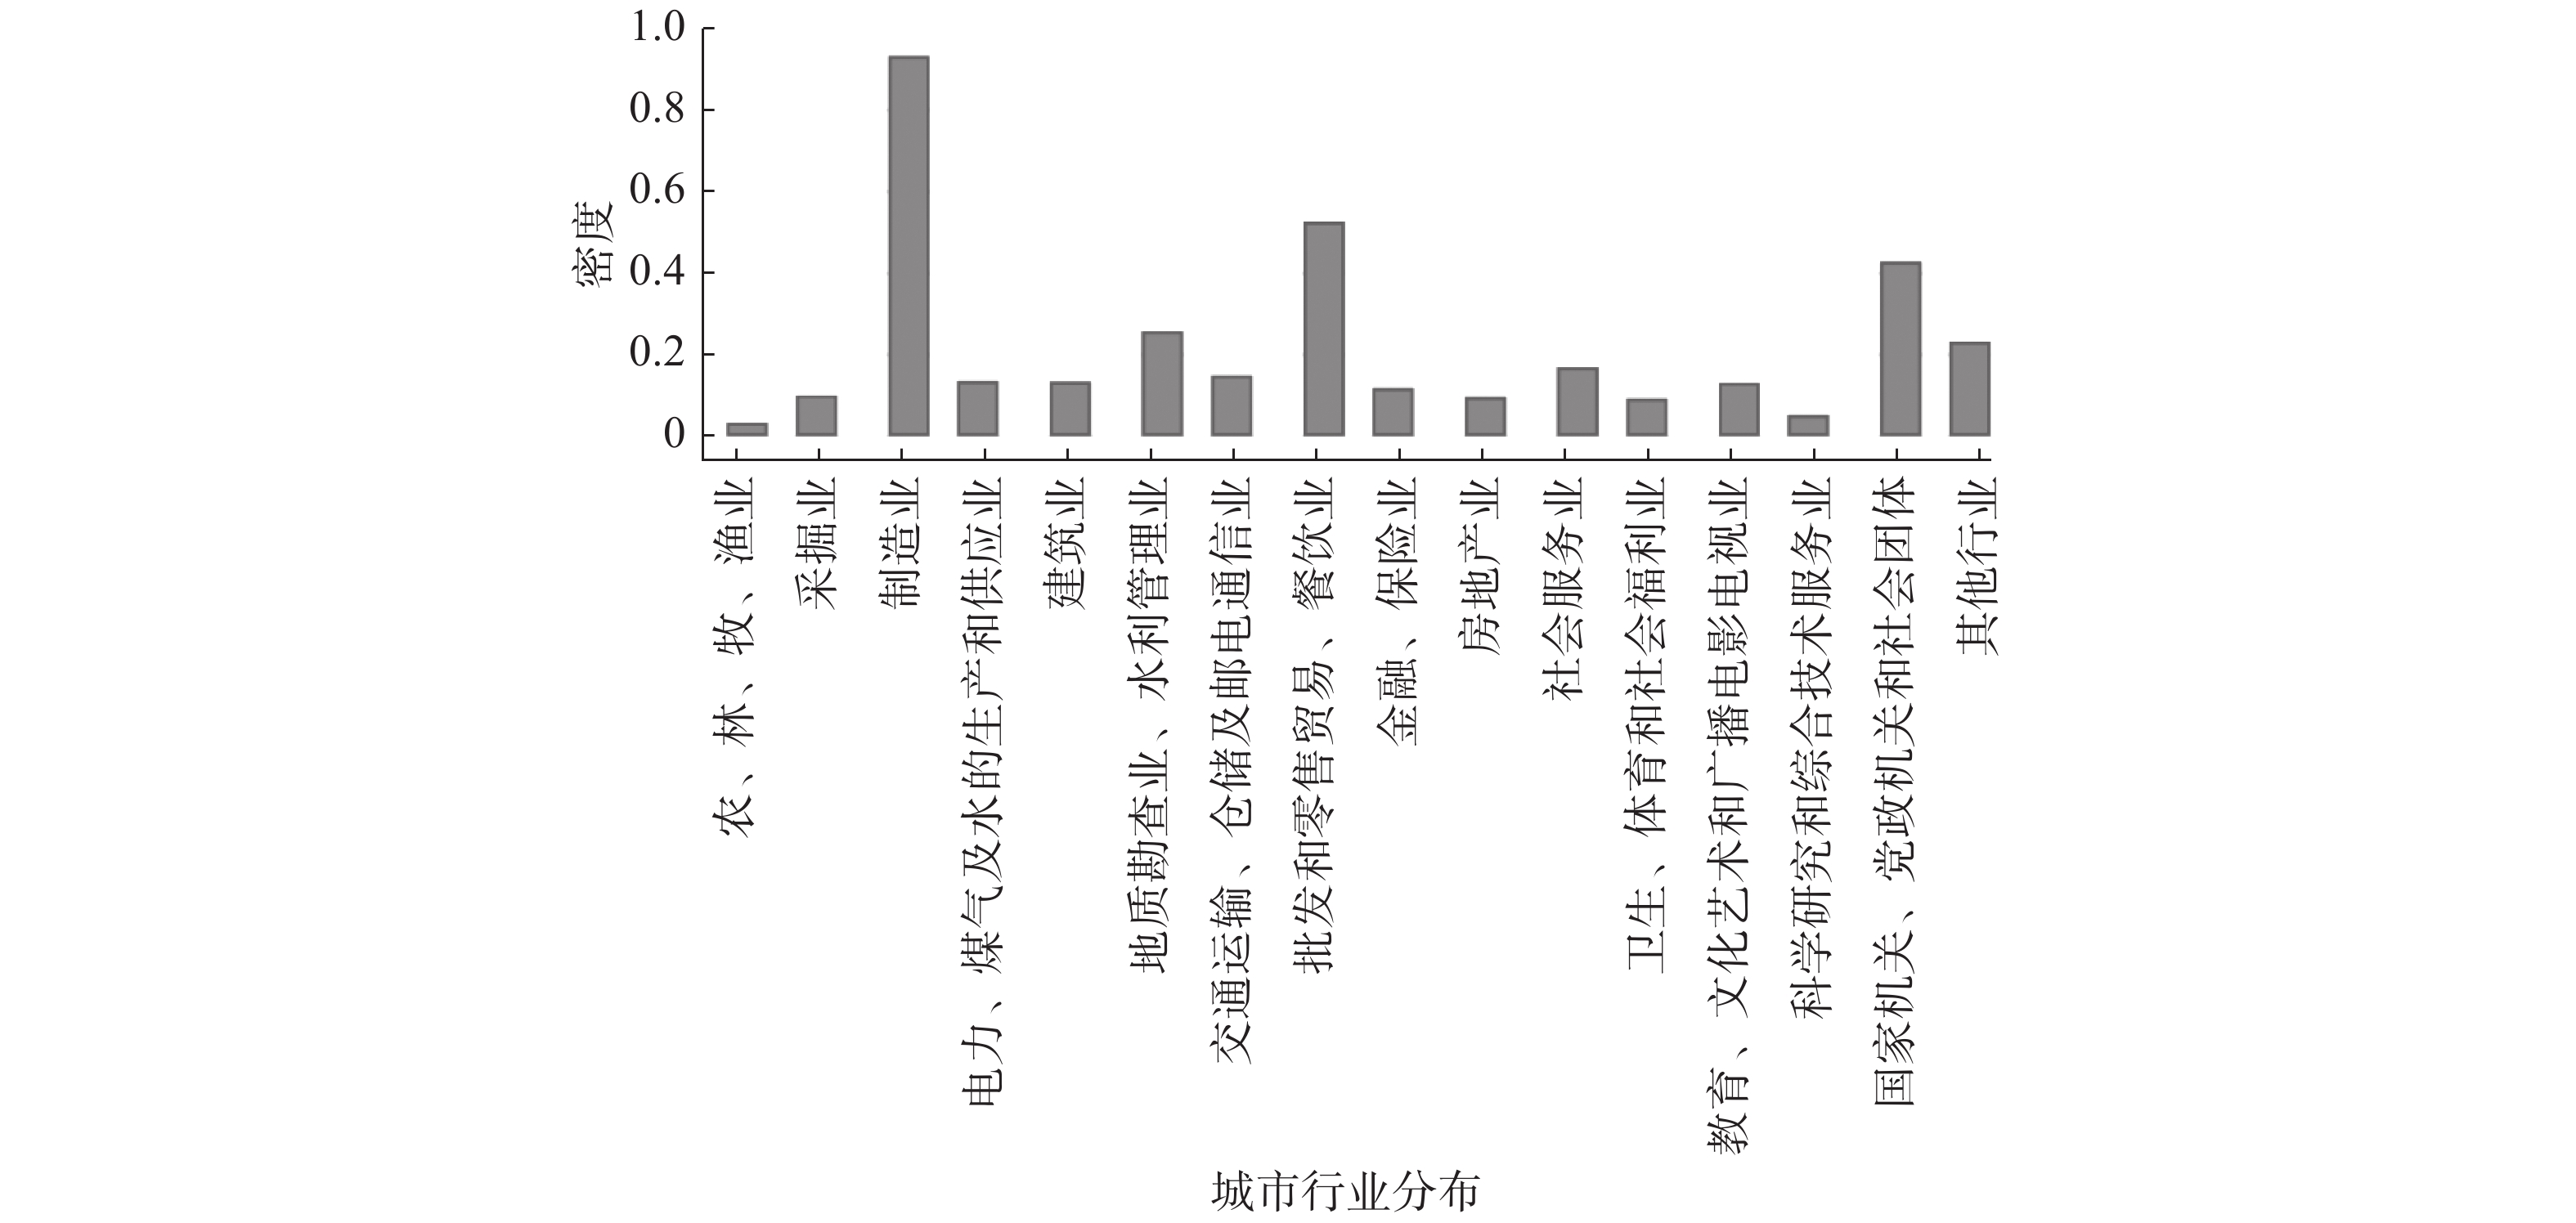
摘要: 从城市职业类型分布的角度测算中国城市的职业多样性和趋势,并探讨城市特征对于城市职业多样性的影响,可以为引导城市充分高质量就业提供参考。通过采用改进的赫芬达尔指数、面板数据固定效应模型和Oaxaca-Blinder分解等方法,研究发现,2002−2016年期间中国城市职业多样性呈现出先降后升的趋势,其原因在于城市产业结构的调整以及金融危机后新经济的出现;同时,城市规模越大、行政等级越高、经济越发达,对应的职业多样性程度越高。研究结论有助于直观了解不同城市的职业分布、产业结构和分工现状,评估城市的人力资源结构和经济发展潜能,进而为不同城市制定产业发展及人力资源规划提供政策建议。Abstract: This paper innovatively measures the occupational diversity and trends in Chinese cities from the perspective of the distribution of urban occupational types, and explores the influence of urban characteristics on urban occupational diversity, with a view to providing reference for guiding the full and high-quality employment in cities. Based on the improved Herfindahl index, the fixed effect model of panel data and the Oaxaca-Binder decomposition method, we found that the occupational diversity in Chinese cities decreased first and then increased during the period from 2002 to 2016, which was due to the adjustment of urban industrial structure and the emergence of new economy after the financial crisis. At the same time, the larger the city size, the higher the administrative level and the more developed the economy, the higher the degree of occupational diversity. In the context of promoting full and high-quality employment in cities, the conclusions of this paper are helpful to intuitively understand the current situation of job distribution, industrial structure and division of labor in different cities, evaluate the human resource structure and economic development potential of cities, and then provide reference for different cities to formulate industrial development and human resource policies.
-
表 2 不同类别城市职业多样性的回归分析
因变量:城市职业多样性(lnwork_rate) 模型1 模型2 模型3 模型4 模型5 经济水平 0.004*** (0.000) 不同地区 0.006*** (0.001) 产业结构 −0.004*** (0.000) 行政等级 0.010*** (0.001) 城市规模 0.005*** 0.002*** 0.002*** 0.002*** 0.003*** (0.000) (0.000) (0.000) (0.000) (0.000) 地区生产总值(lngdp) 0.009*** 0.012*** 0.012*** 0.012*** 0.011*** (0.000) (0.000) (0.000) (0.000) (0.000) 职工平均工资(lnwage) −0.006*** −0.006*** −0.006*** −0.006*** −0.006*** (0.001) (0.001) (0.001) (0.001) (0.001) 第三产业产值比重(third_share) −0.000*** −0.000*** −0.000*** −0.000*** 0.000*** (0.000) (0.000) (0.000) (0.000) (0.000) 省份普通高校数目(lnpro_uni) −0.043*** −0.043*** −0.043*** −0.043*** −0.042*** (0.001) (0.001) (0.001) (0.001) (0.001) 可支配收入(lnincome_dis) 0.001*** 0.001*** 0.001*** 0.001*** 0.001*** (0.000) (0.000) (0.000) (0.000) (0.000) 户口类型(hukou) 0.000** 0.000** 0.000** 0.000** 0.000*** (0.000) (0.000) (0.000) (0.000) (0.000) 受教育程度(education) −0.000 −0.000 −0.000 −0.000 −0.000 (0.000) (0.000) (0.000) (0.000) (0.000) 就业情况(employment) −0.000*** −0.000*** −0.000*** −0.000*** −0.000*** (0.000) (0.000) (0.000) (0.000) (0.000) 职业类型(work_type) −0.000*** −0.000*** −0.000*** −0.000*** −0.000*** (0.000) (0.000) (0.000) (0.000) (0.000) 常数项 0.760*** 0.735*** 0.735*** 0.735*** 0.725*** (0.008) (0.008) (0.008) (0.008) (0.008) 年份固定效应 YES YES YES YES YES 城市固定效应 YES YES YES YES YES 观测值 604748 604748 604748 604748 604748 城市数 142 142 142 142 142 R^2 0.706 0.706 0.706 0.706 0.706 注:括号内数值为稳健性标准误;*、**、***分别代表在10%、5%和1%的水平上显著;与城市特征变量进行匹配后,回归中最终使用的城市样本数为142个。  下载: 导出CSV
表 3 Oaxaca-Blinder分解结果
可解释部分 比重 不可解释部分 比重 总差异 0.0192*** (0.000175) 可解释差异 −0.0181*** 32.73% (0.000693) 不可解释差异 0.0372*** 67.27% (0.000712) 地区生产总值(lngdp) 0.0457*** 39.64% −0.197*** 22.33% (0.000751) (0.00657) 年末人口(lnpop) −0.0436*** 37.81% 0.263*** 29.81% (0.000864) (0.00345) 职工平均工资(lnwage) −0.0231*** 20.03% 0.380*** 43.06% (0.000206) (0.00650) 第三产业比重(third_share) 0.00290*** 2.52% −0.0424*** 4.81% (0.000129) (0.000898) 常数项 −0.367*** (0.00464) 观测值 604757 604757 604757 注:括号内数值为稳健性标准误;*、**、***分别代表在10%、5%和1%的水平上显著。
下载: 导出CSV
表 4 职业多样性指数与方言多样性指数相关性
职业多样性指数(work_rate) 行业多样性指数(industry_rate) 方言多样性指数(diversity) −0.0794***
(p=0.0000)−0.1062***
(p=0.0000)行业多样性指数(industry_rate) 0.5367***
(p=0.0000)/
下载: 导出CSV
-

 下载:
下载:


 点击查看大图
图(7)表(4)
计量
- 文章访问数: 5013
- HTML全文浏览量: 499
 沪公网安备 31010102003103号