
金融业“过度”扩张:中国的事实与解释
The “Excessive” Expansion of Financial Industry: The Fact and Interpretation from China
-
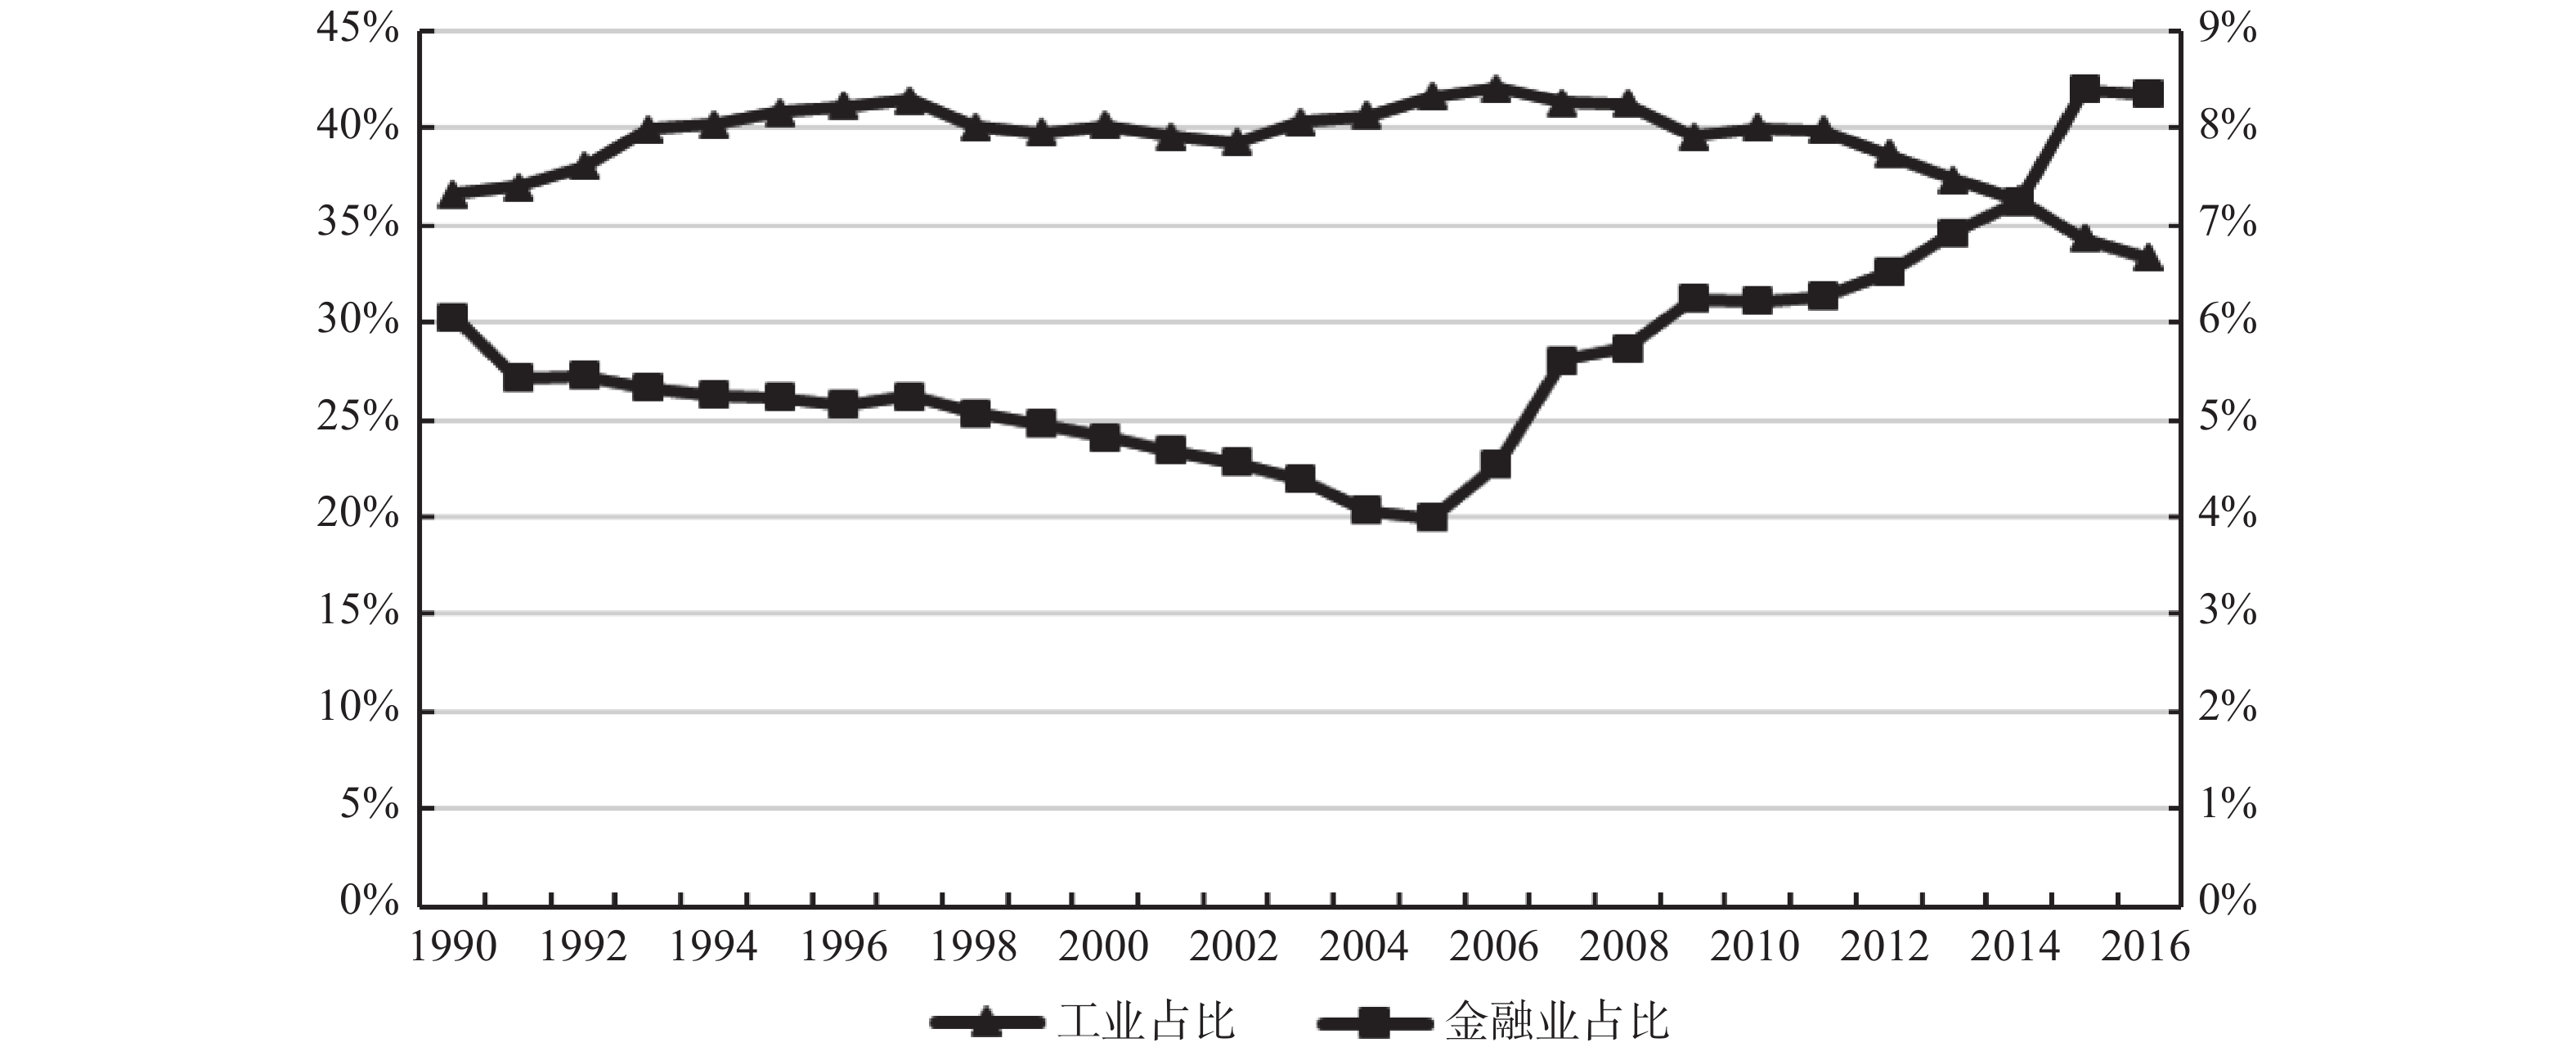
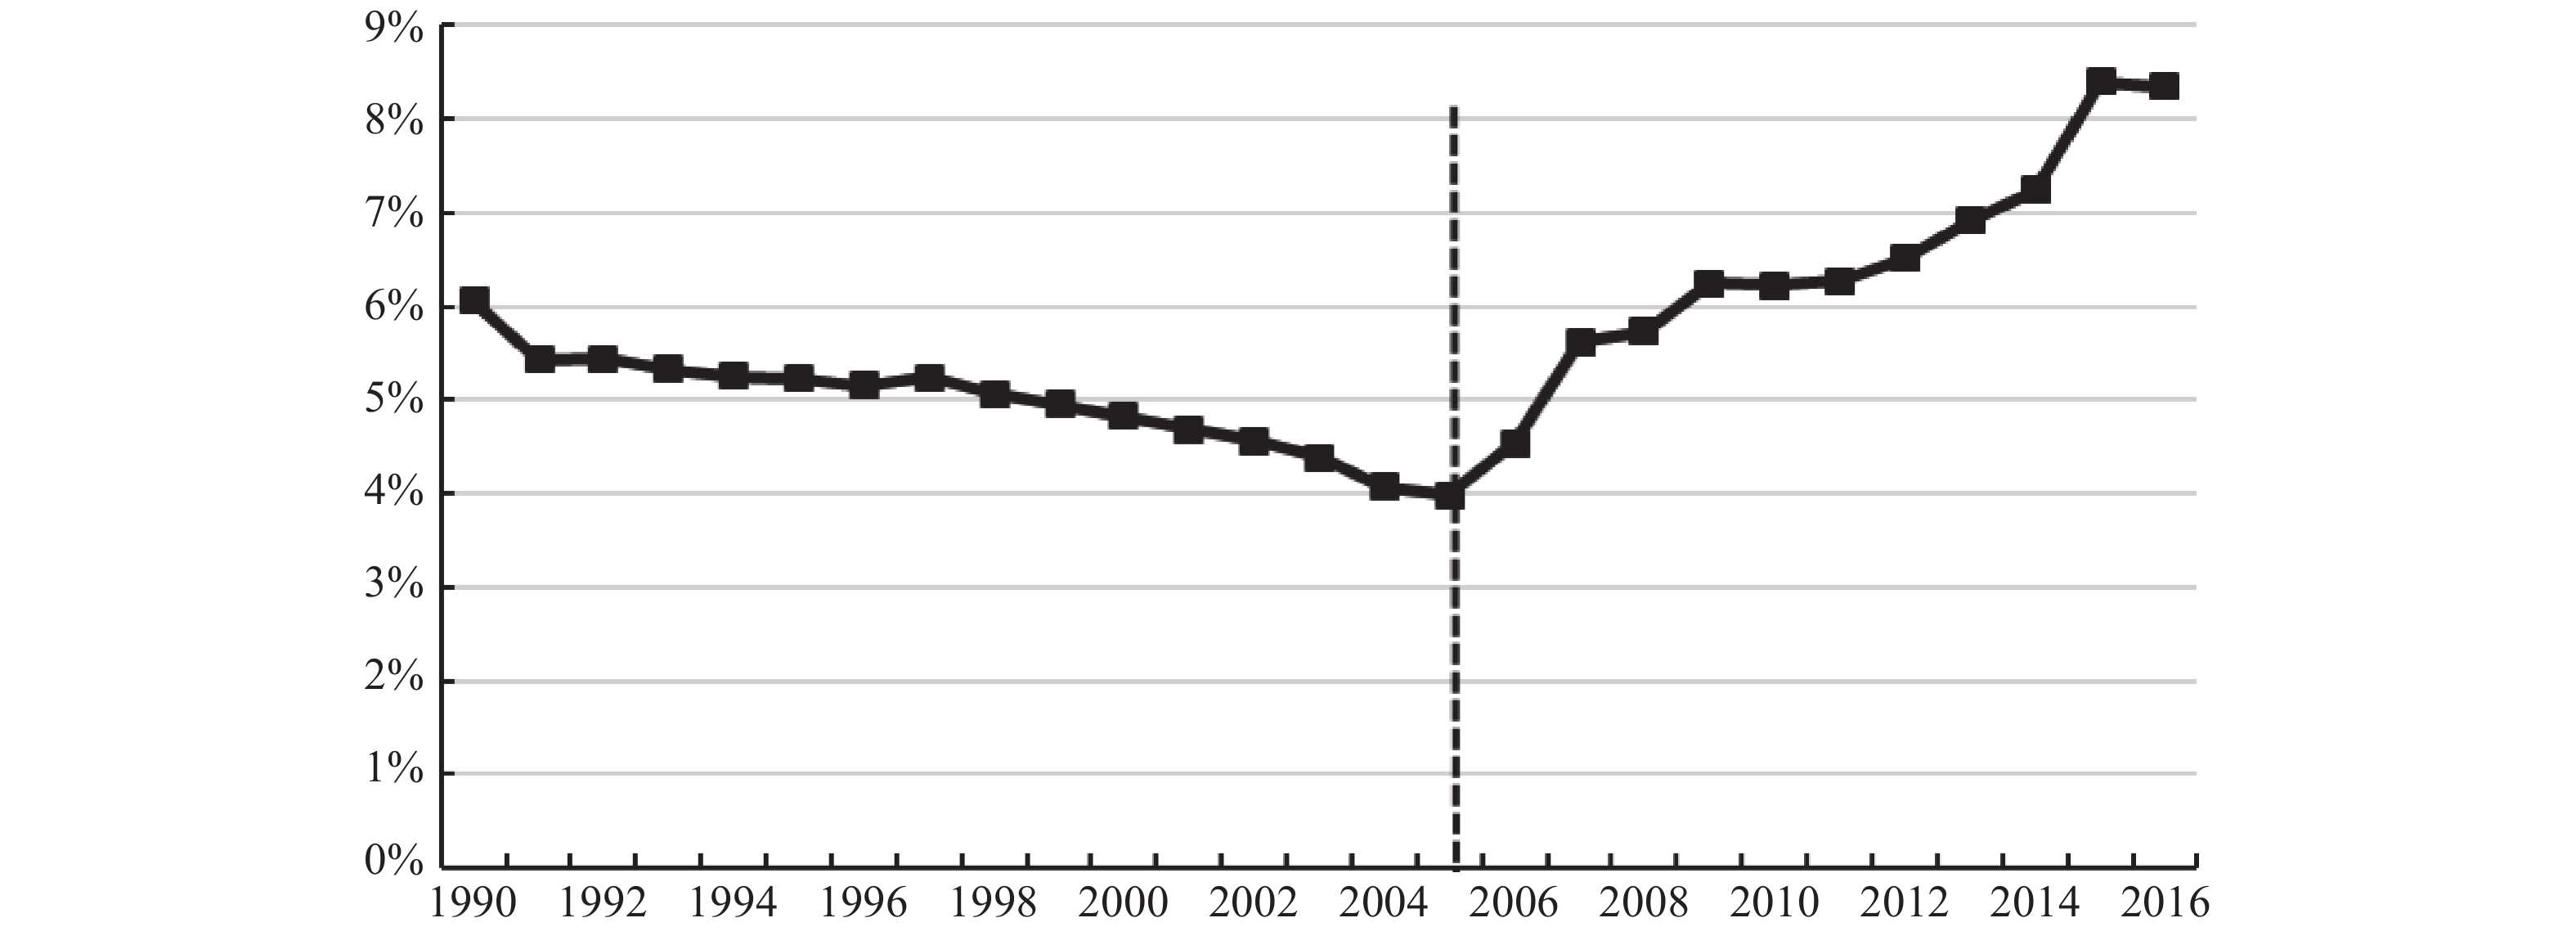
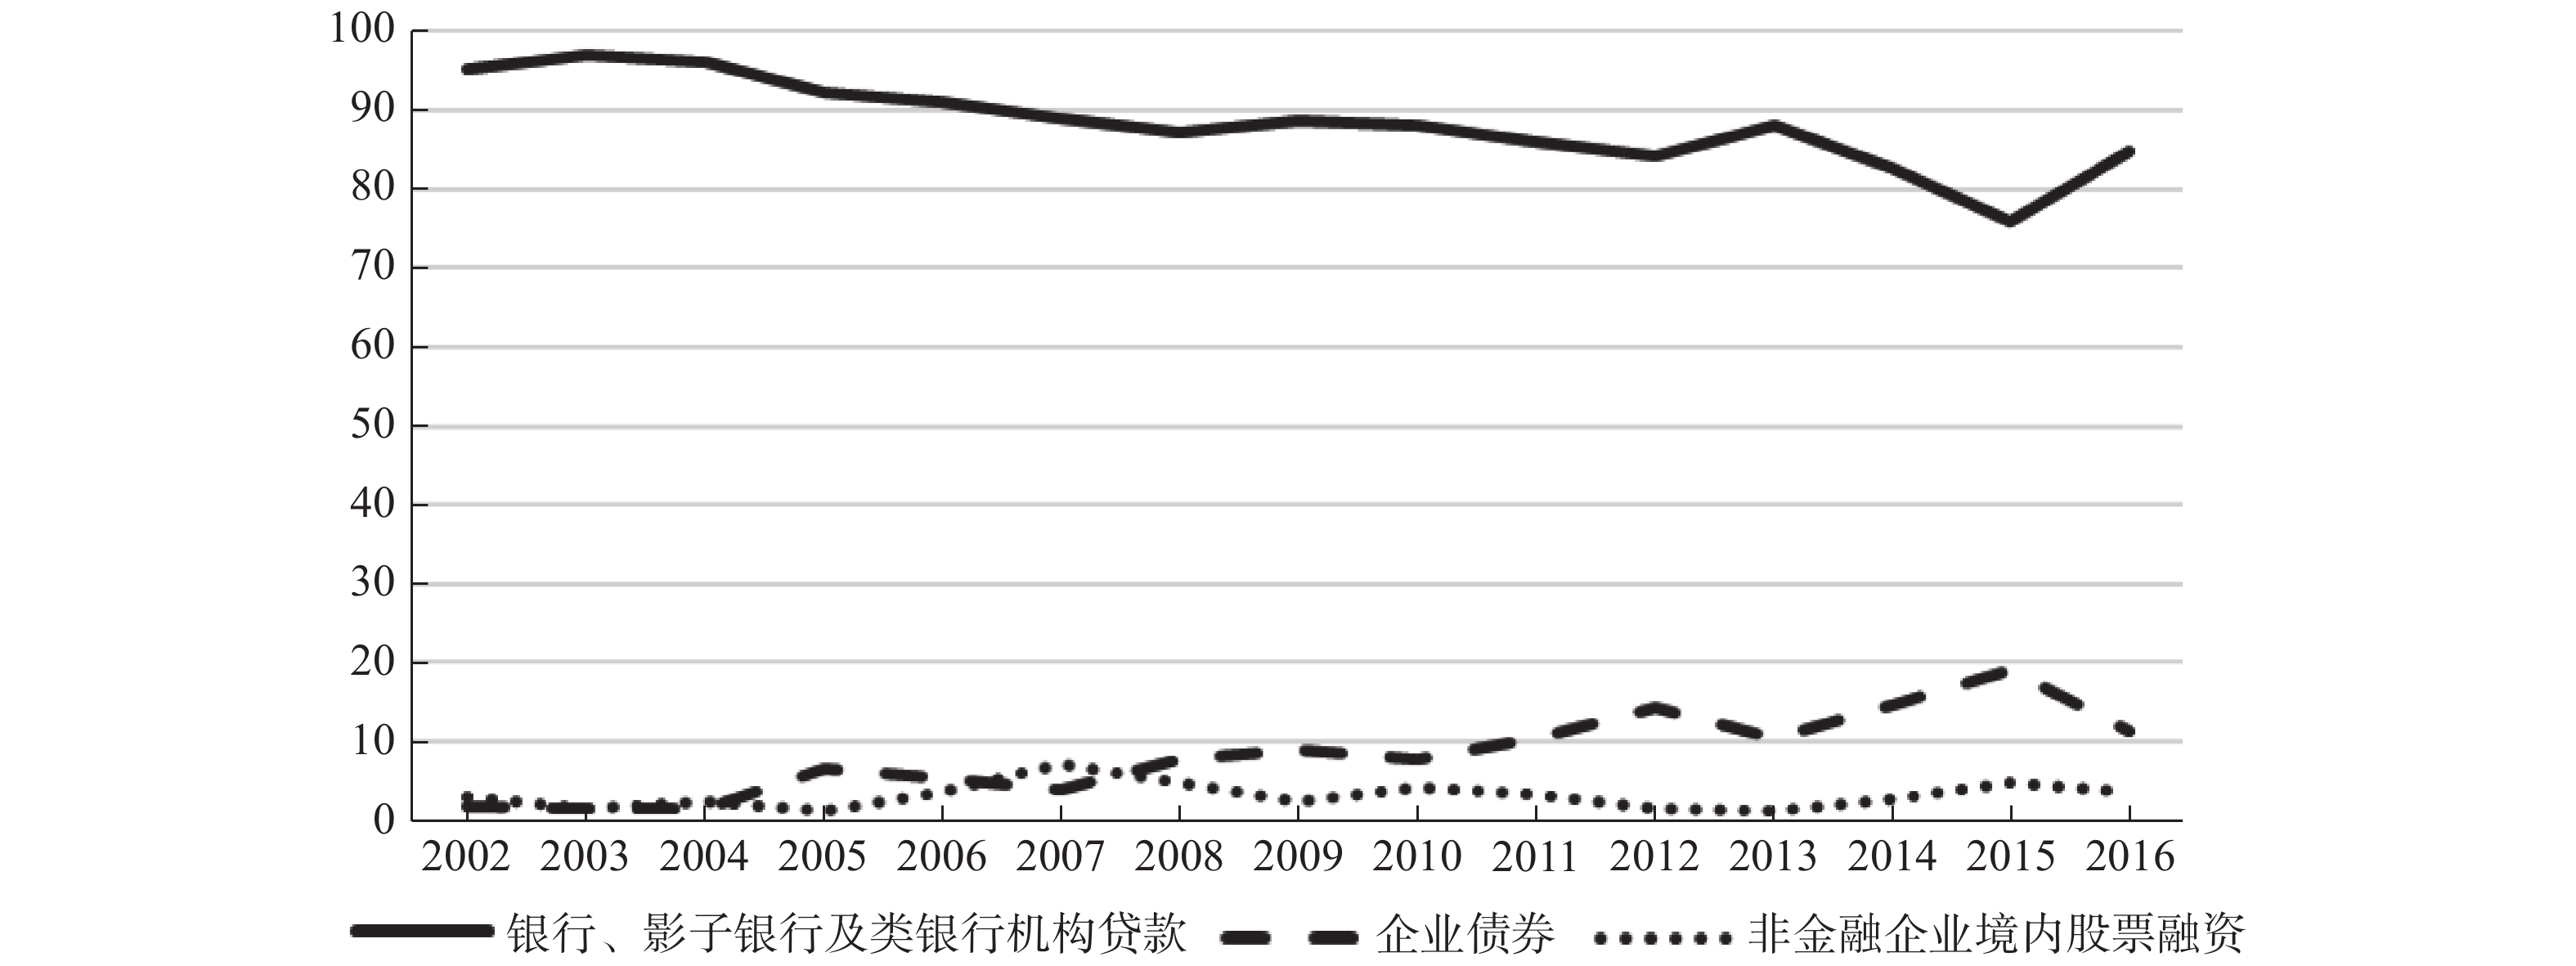
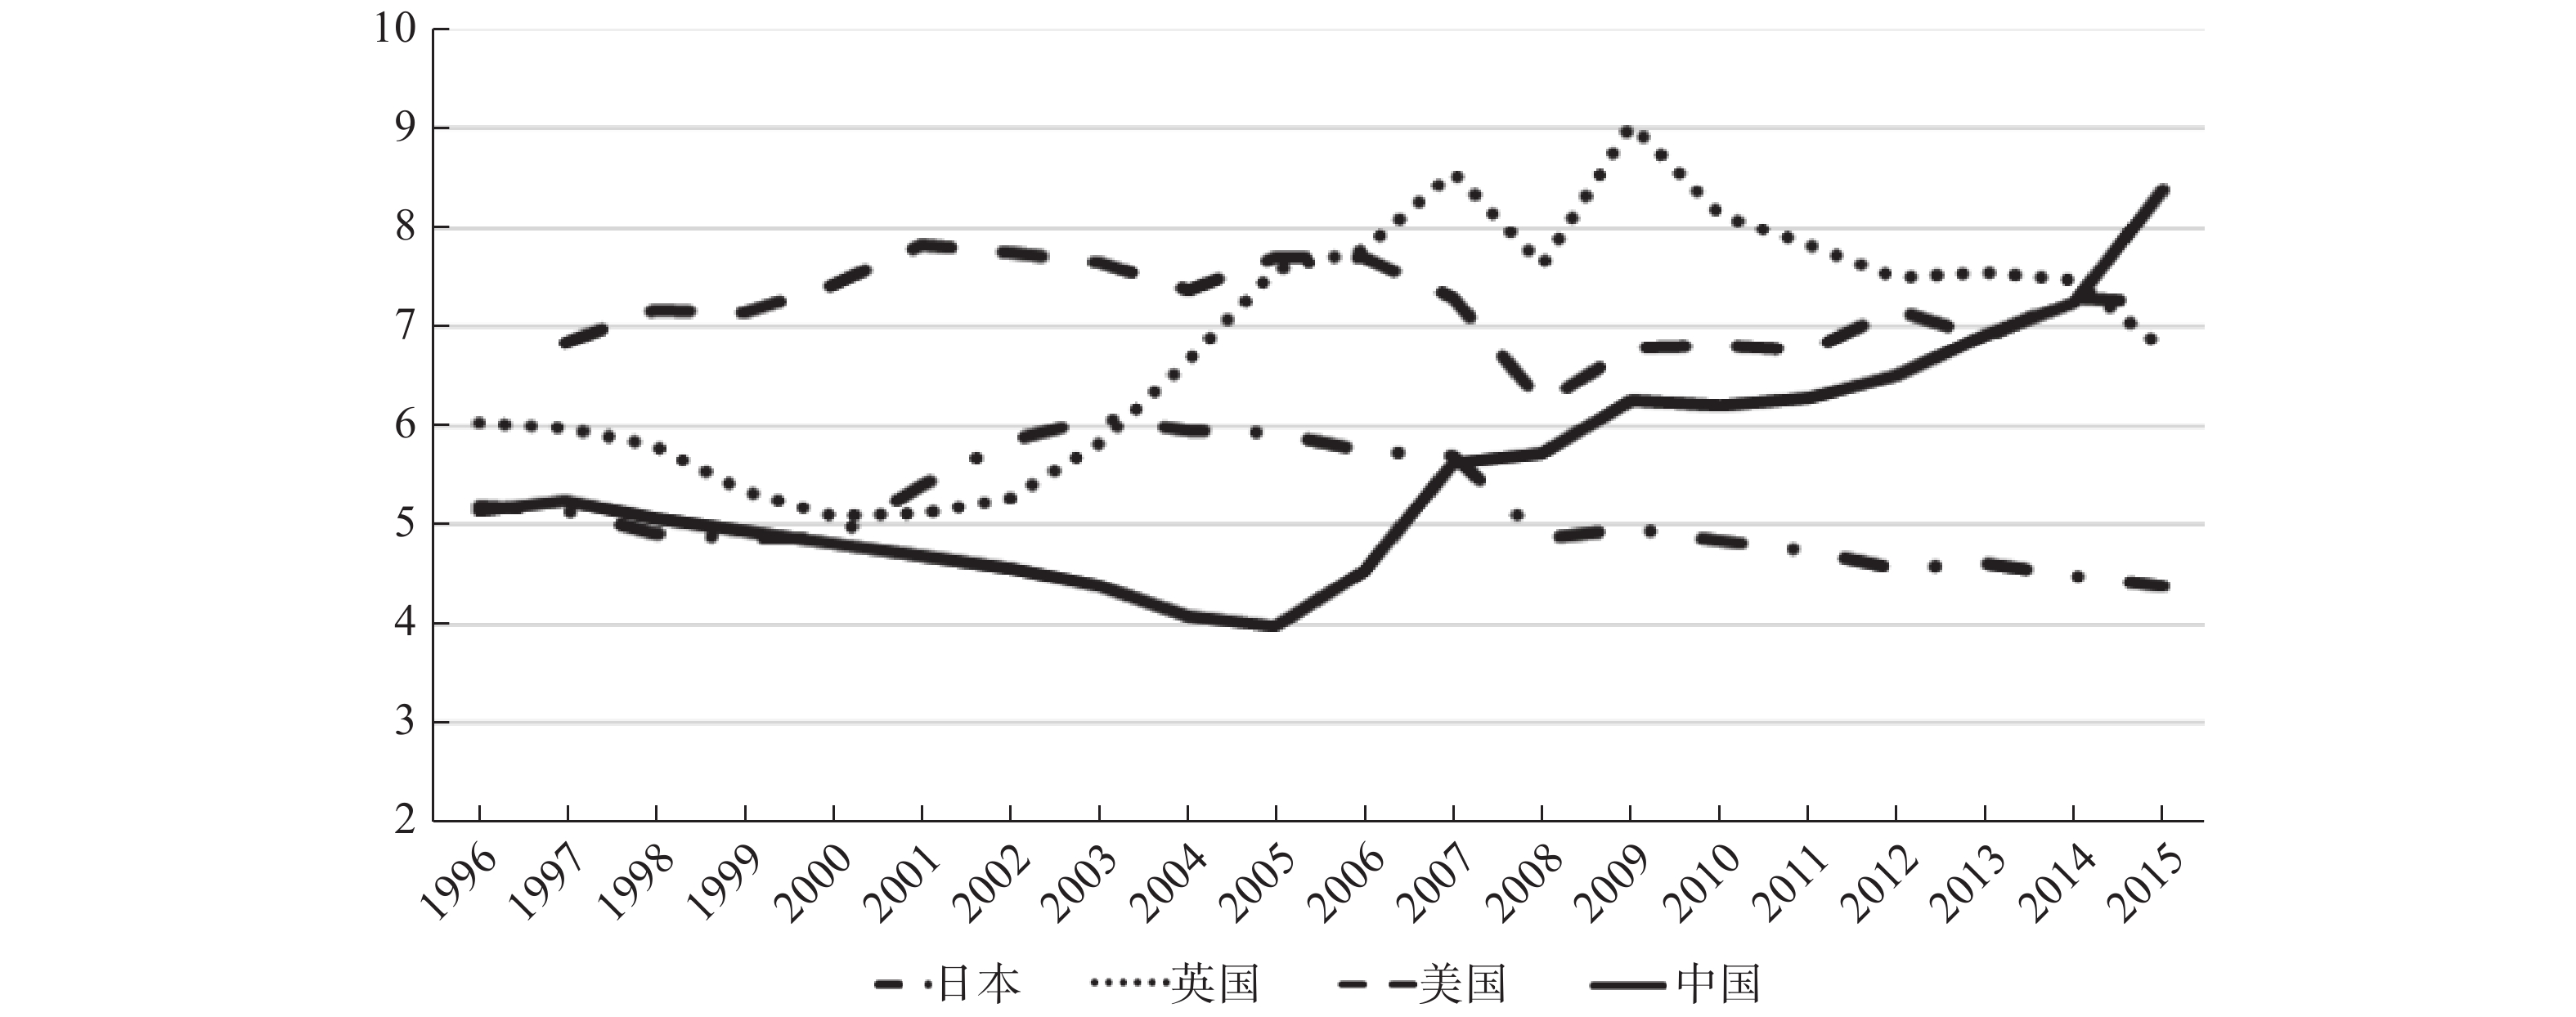
摘要: 2005年之后中国的金融业增加值占GDP比重呈现出快速增长的态势,并且出现了超越美英日等发达国家的典型现象,表现为金融业“过度”扩张的特征事实。以2005年之后中国相继出台的银行业务和经营范围管制放松政策冲击效应为基础,构造相应的工具变量,可检验出中国各省份地区中金融业增加值占GDP比重提升对地区工业增加值占GDP比重的影响效应。实证结果揭示出,中国情景下金融业“过度”扩张对以工业部门为主的实体经济发展造成了显著的抑制效应,并发现这种抑制效应是通过金融业“过度”扩张对工业部门固定资产投资所产生的挤出效应而形成。进一步的检验结果发现,中国金融业“过度”扩张的内在动因,既与金融业扩张可以促进地区GDP的快速增长,导致地方政府偏向于发展金融业的激励机制密切相关;又与金融业扩张可以带来地区财政收入的激励动机有关;同时,还与金融业扩张可以强化地方政府债务筹集能力的激励动机相关。研究结果为深入理解中国金融业“过度”扩张的典型事实、判断依据与形成机制提供了独特的实证证据,也为检验和判断推进中国金融体制改革的必要性和可能的改革方向提供了必要的政策参考依据。
-
关键词:
- 金融业“过度”扩张 /
- 金融业增加值占GDP比重 /
- 工业增加值占GDP比重 /
- 挤出效应 /
- 动因分析
Abstract: The ratio of value added of financial industry to GDP shows the trend of rapid growth after the year 2005, and a typical phenomenon has emerged that the value of that ratio in China has surpassed those values in developed countries, such as US, UK, Japan, as so on. We conclud that phenomenon as the stylized fact of the “excessive” expansion of the financial industry. This paper examines the effect of the growth of the ratio value added of financial industry to GDP on the ratio of value added of industrial sector to GDP, by constructing relative instruments variables based on the foundation of identifying the policy shock effect of China’s successively promulgated deregulation of bank business and regulation relaxation policy on the scope of bank business and operation. The empirical results reveal that, the “excessive” expansion of the financial industry with Chinese background, has significant inhibitory effect on the development of the real economy mainly contributed by manufacturing sector, and the inhibitory effect is driven by the extrusion effect on fixed asset investment of industrial sector. The further findings show that, as for the inner motivations of “excessive” expansion of the financial industry, it may closely relate to the financial incentive of local government in favor of the development of financial industry since the expansion can bring the rapid GDP growth. It also has close connection to the incentive motivation of the increase of regional financial income caused by financial expansion. Meanwhile, it may relate to the incentive motivation that the expansion can strengthen the capability of local governments’ debt. A series of empirical findings in this paper, provide unique empirical evidence for deeply understanding the stylized fact, judgment basis and formation mechanism of “excessive” expansion of the financial industry in China, and provides necessary policy reference for the necessity and possible direction of the reform of China’s financial system. -
表 1 中国金融业增加值占GDP比重对工业部门增加值占GDP比重影响效应的检验结果
(估计方法:OLS) 模型1 模型2 模型3 模型4 模型5 模型6 样本期间 1993—2016年 1993—2004年 2005—2016年 1993—2016年 1993—2004年 2005—2016年 finance_gdp −0.4267***
(−2.66)0.2694
(1.46)−1.1520***
(−3.83)−0.4287***
(−2.68)0.2699
(1.47)−1.0490***
(−3.95)export_gdp 0.0228
(0.71)0.0480
(0.86)0.1907***
(6.27)Constant 0.3335***
(11.25)0.2583***
(8.05)0.3578***
(7.54)0.3261***
(11.12)0.2394***
(5.85)0.2947***
(6.54)Province 控制 控制 控制 控制 控制 控制 Year 控制 控制 控制 控制 控制 控制 Adjusted-R2 0.8153 0.9038 0.8155 0.8151 0.9043 0.9245 Obs 744 372 372 744 372 372 注:***、**、*分别表示1%、5%、10%(双尾)的统计显著性水平。括号内的数值为经过异方差调整过的t值或Z值。  下载: 导出CSV
表 2 中国金融业增加值占GDP比重对工业部门增加值占GDP比重影响效应的检验结果
(估计方法:2SLS) 模型1 模型2 模型3 模型4 模型5 模型6 工具变量不同
设计方法2004年 1999—2004年 1993—2004年 2004年 1999—2004年 1993—2004年 finance_gdp −1.8498**
(−2.21)−2.9076***
(−3.50)−4.2004***
(−4.51)−1.2136**
(−2.04)−1.9499***
(−2.78)−2.5489***
(−3.01)export_gdp 0.1989***
(6.72)0.1907***
(6.03)0.1759***
(4.55)Constant 0.4656***
(3.54)0.6290***
(4.82)0.8267***
(5.72)0.1637**
(2.11)0.2949**
(2.05)0.5301***
(3.97)Province 控制 控制 控制 控制 控制 控制 Year 控制 控制 控制 控制 控制 控制 第一阶段F值 134.51*** 133.37*** 134.14*** 131.23*** 130.30*** 131.08*** Adjusted-R2 0.9116 0.8981 0.8657 0.9209 0.9245 0.9129 Observations 372 372 372 372 372 372 注:***、**、*分别表示1%、5%、10%(双尾)的统计显著性水平。括号内的数值为经过异方差调整过的t值或Z值。
下载: 导出CSV
表 3 中国金融业扩张对工业部门抑制效应的2SLS稳健性检验结果
模型1 模型2 模型3 模型4 模型5 模型6 工具变量不同设计方法 2004年 1999—2004年 1993—2004年 2004年 1999—2004年 1993—2004年 finance_gdp −1.1782***
(−3.46)−1.2621***
(−3.87)−1.8082***
(−4.65)−1.2274***
(−2.67)−1.3763***
(−3.12)−1.6539***
(−3.45)export_gdp 0.2305***
(6.24)0.2284***
(6.39)0.2397***
(6.51)0.2139***
(6.54)0.2095***
(6.73)0.2116***
(6.39)Constant 0.7620***
(4.72)0.5548***
(5.26)0.7912***
(5.70)0.4520***
(3.18)0.5094**
(4.21)0.4197***
(4.65)Province 控制 控制 控制 控制 控制 控制 Year 控制 控制 控制 控制 控制 控制 第一阶段F值 147.71*** 142.33*** 145.98*** 141.24*** 144.25*** 143.0*** Adjusted-R2 0.9136 0.9175 0.9203 0.9226 0.9217 0.9168 Observations 372 372 360 372 372 372 注:***、**、*分别表示1%、5%、10%(双尾)的统计显著性水平。括号内的数值为经过异方差调整过的t值或Z值。模型3样本量为360的原因在于,由于缺失西藏1997年之前的部分金融业就业人员数,因此,回归模型剔除了西藏样本。
下载: 导出CSV
表 4 中国金融业扩张对投资挤出效应的工具变量2SLS检验结果
模型1 模型2 模型3 模型4 模型5 模型6 被解释变量 中国各省份地区固定
资产投资额/GDP中国各省份地区房地产
投资额/GDP中国各省份地区工业部门
固定投资额/GDP工具变量不同设计方法 2004年 1993—2004年 2004年 1993—2004年 2004年 1993—2004年 fiannce_gdp −6.5478**
(−2.14)−6.7267**
(−2.45)0.1870
(0.19)−0.2749
(−0.34)−6.7347***
(−3.65)−6.4519***
(−3.26)export_gdp 0.6831***
(6.12)0.6813***
(5.75)0.1037***
(3.91)0.0991***
(4.45)0.5794***
(5.42)0.5822***
(5.17)Constant 1.3602***
(2.82)1.3883**
(2.56)0.1673
(1.06)02397*
(1.87)1.1929***
(2.96)0.1485**
(2.52)Province 控制 控制 控制 控制 控制 控制 Year 控制 控制 控制 控制 控制 控制 第一阶段F值 131.23*** 131.08*** 131.23*** 131.08*** 131.23*** 131.08*** Adjusted-R2 0.8312 0.8294 0.7736 0.7708 0.8479 0.8509 Observations 372 372 372 372 372 372 注:***、**、*分别表示1%、5%、10%(双尾)的统计显著性水平。括号内的数值为经过异方差调整过的t值或Z值。
下载: 导出CSV
表 5 中国金融业扩张动因识别的2SLS检验结果
模型1 模型2 模型3 模型4 模型5 模型6 被解释变量 中国各省份地区财政收入/GDP 中国各省份地区城投债发行额/GDP 工具变量形式 1993—2004年 finance_gdp 0.7365***
(2.80)1.1378***
(3.20)0.9247***
(4.78)0.3873***
(3.29)0.6529***
(3.44)0.6137***
(3.18)manufacture_gdp 0.0955***
(3.21)0.1201***
(4.70)0.6091***
(2.71)0.5265***
(2.68)finance_gdp×
manufacture_gdp−1.8490***
(−4.95)−1.1243***
(−3.50)Constant 0.7640*
(1.85)−0.0028
(−0.05)0.0836***
(3.52)0.3036***
(6.24)0.2375***
(4.99)0.2871***
(5.23)Province 控制 控制 控制 控制 控制 控制 Year 控制 控制 控制 控制 控制 控制 Adjusted-R2 0.9210 0.9043 0.9428 0.9127 0.8963 0.9217 第一阶段F值 134.14*** 136.11*** 352.25*** 134.14*** 136.11*** 352.25*** Obs 372 372 372 372 372 372 注:***、**、*分别表示1%、5%、10%(双尾)的统计显著性水平。括号内的数值为经过异方差调整过的t值。
下载: 导出CSV
-

 下载:
下载:

 点击查看大图
图(4)表(5)
计量
- 文章访问数: 4599
- HTML全文浏览量: 561
 沪公网安备 31010102003103号