
城市化转型:从高速度到高质量
The Transition from High-speed to the High-quality of China’s Urbanization
 ;第二个恒等式是货币数量方程。参见保罗·罗默:《宏观经济学的困境》,秦蒙译,《政治经济学学报》2017年第5期。
-
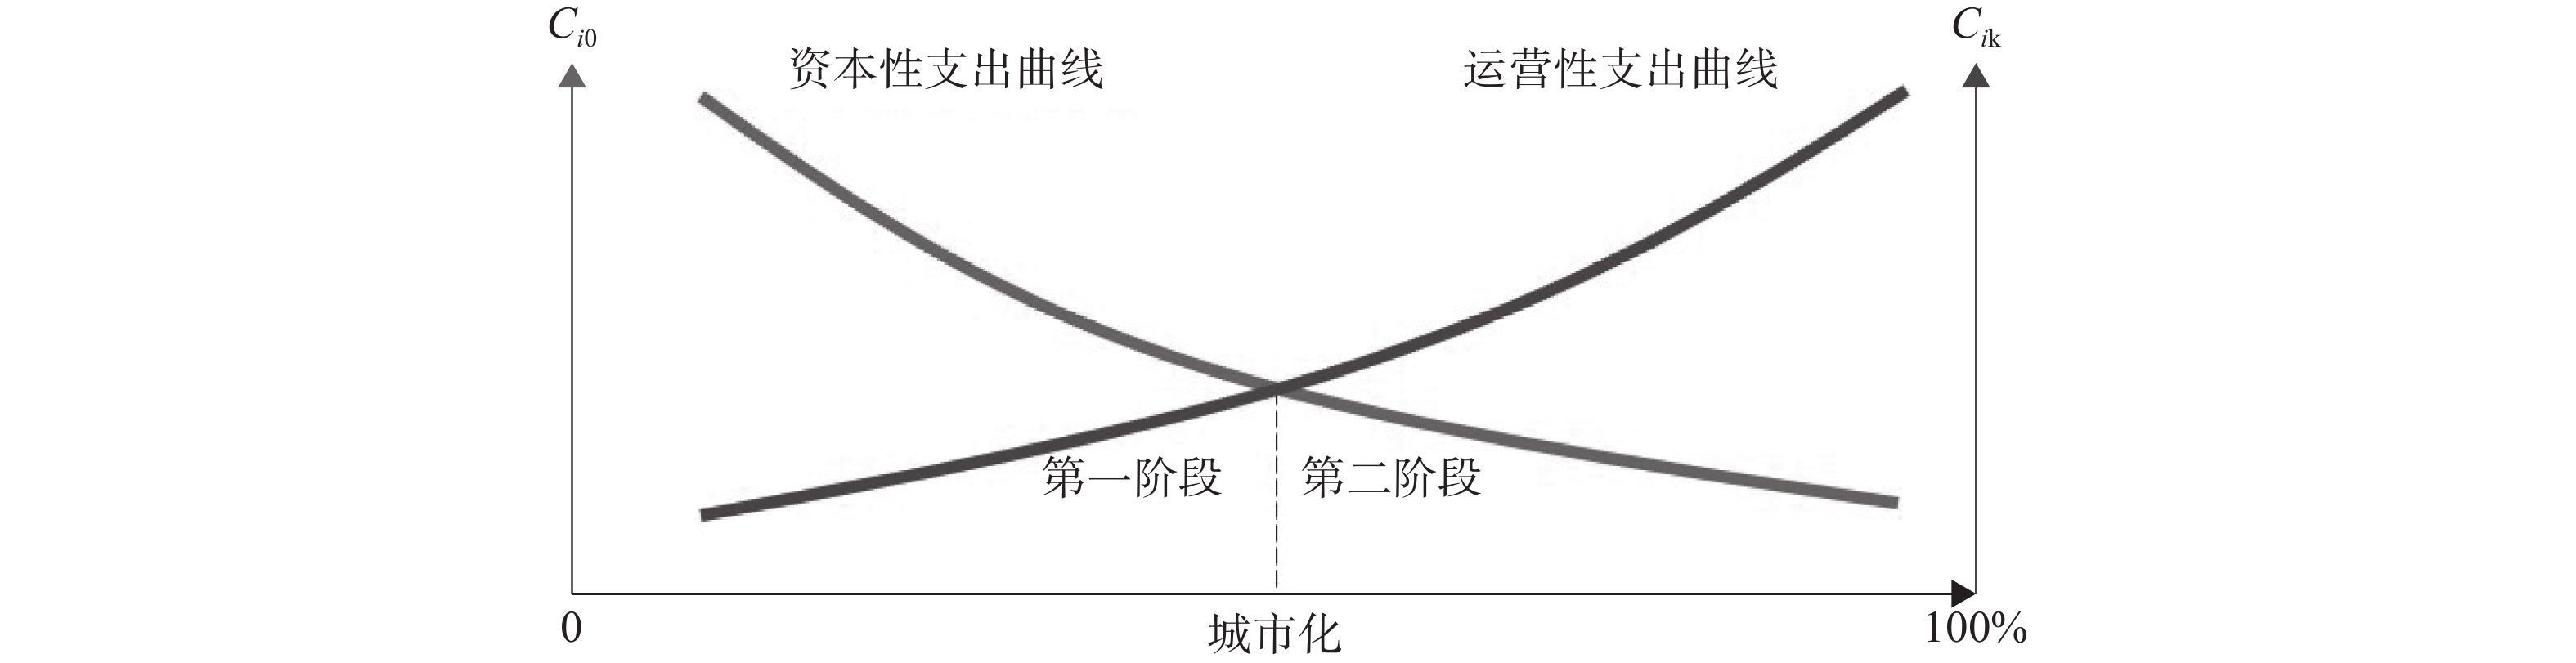
摘要: 中国经济要由高速度增长阶段转向高质量发展阶段,是十九大报告针对新时期中国经济基本特征提出的新表述。何为“高质量发展”,从理论到实践的探索可能才刚刚开始。本文在古典经济增长理论的基础上,构建了涵括微观、中观和宏观,包含资本型增长(投资)和现金流型增长(收益)的两阶段动态经济增长模型。由于资本是未来收益的贴现,在本质上属于债务,进而提出在经济增长过程中,存在资本(存量)和现金流(流量)不能相互替代的“不可替代原则”。在此基础上,基于原始资本获取方式的差别,对传统增长和现代增长进行了区分,并结合中国城市化进程中的地方政府行为、土地金融和资本创造对中国过去四十年的改革和发展的逻辑进行了梳理和总结。在中国城市化进入中后期阶段,中国的城市化需要从此前的资本型增长转换到现金流型增长,这也是中国经济要从高速度向高质量转型的经济学含义。Abstract: China’s economy development should shift from a stage of high-speed to a stage of high-quality, This is an important judgment made by the report on the 19th National Congress of the Communist Party of China (CPC) about the basic characteristics of the current Chinese economy. For the economic implication of high-speed development, whether it succeeds or fails, it need not be explained further. But as for what is high-quality development, the exploration from theory to practice may just begin. Basing on the classical economic growth theory, this paper constructs a two-stage dynamic economic growth model, including capital growth and cash flow growth, the model is applicable to micro-meso-macro economics. Since capital is a discount to future earnings, it is essentially a debt, this paper puts forward the irreplaceable principle that capital and cash flow cannot replace each other in the process of economic growth. On this basis, the traditional growth relying on surplus accumulation in the past and the modern growth relying on discount of future earnings are distinguished. Combined with the local government’s behavior of land finance and capital creation in the urbanization process of China, this paper summarizes the logic of China’s reform and development in the past 40 years. In the middle and late stage of China’s urbanization, the transformation of China’s urbanization needs to change from the previous capital growth to cash flow growth. So this is also the economic implication of the transformation of China’s economy from high-speed growth to high-quality development.
-
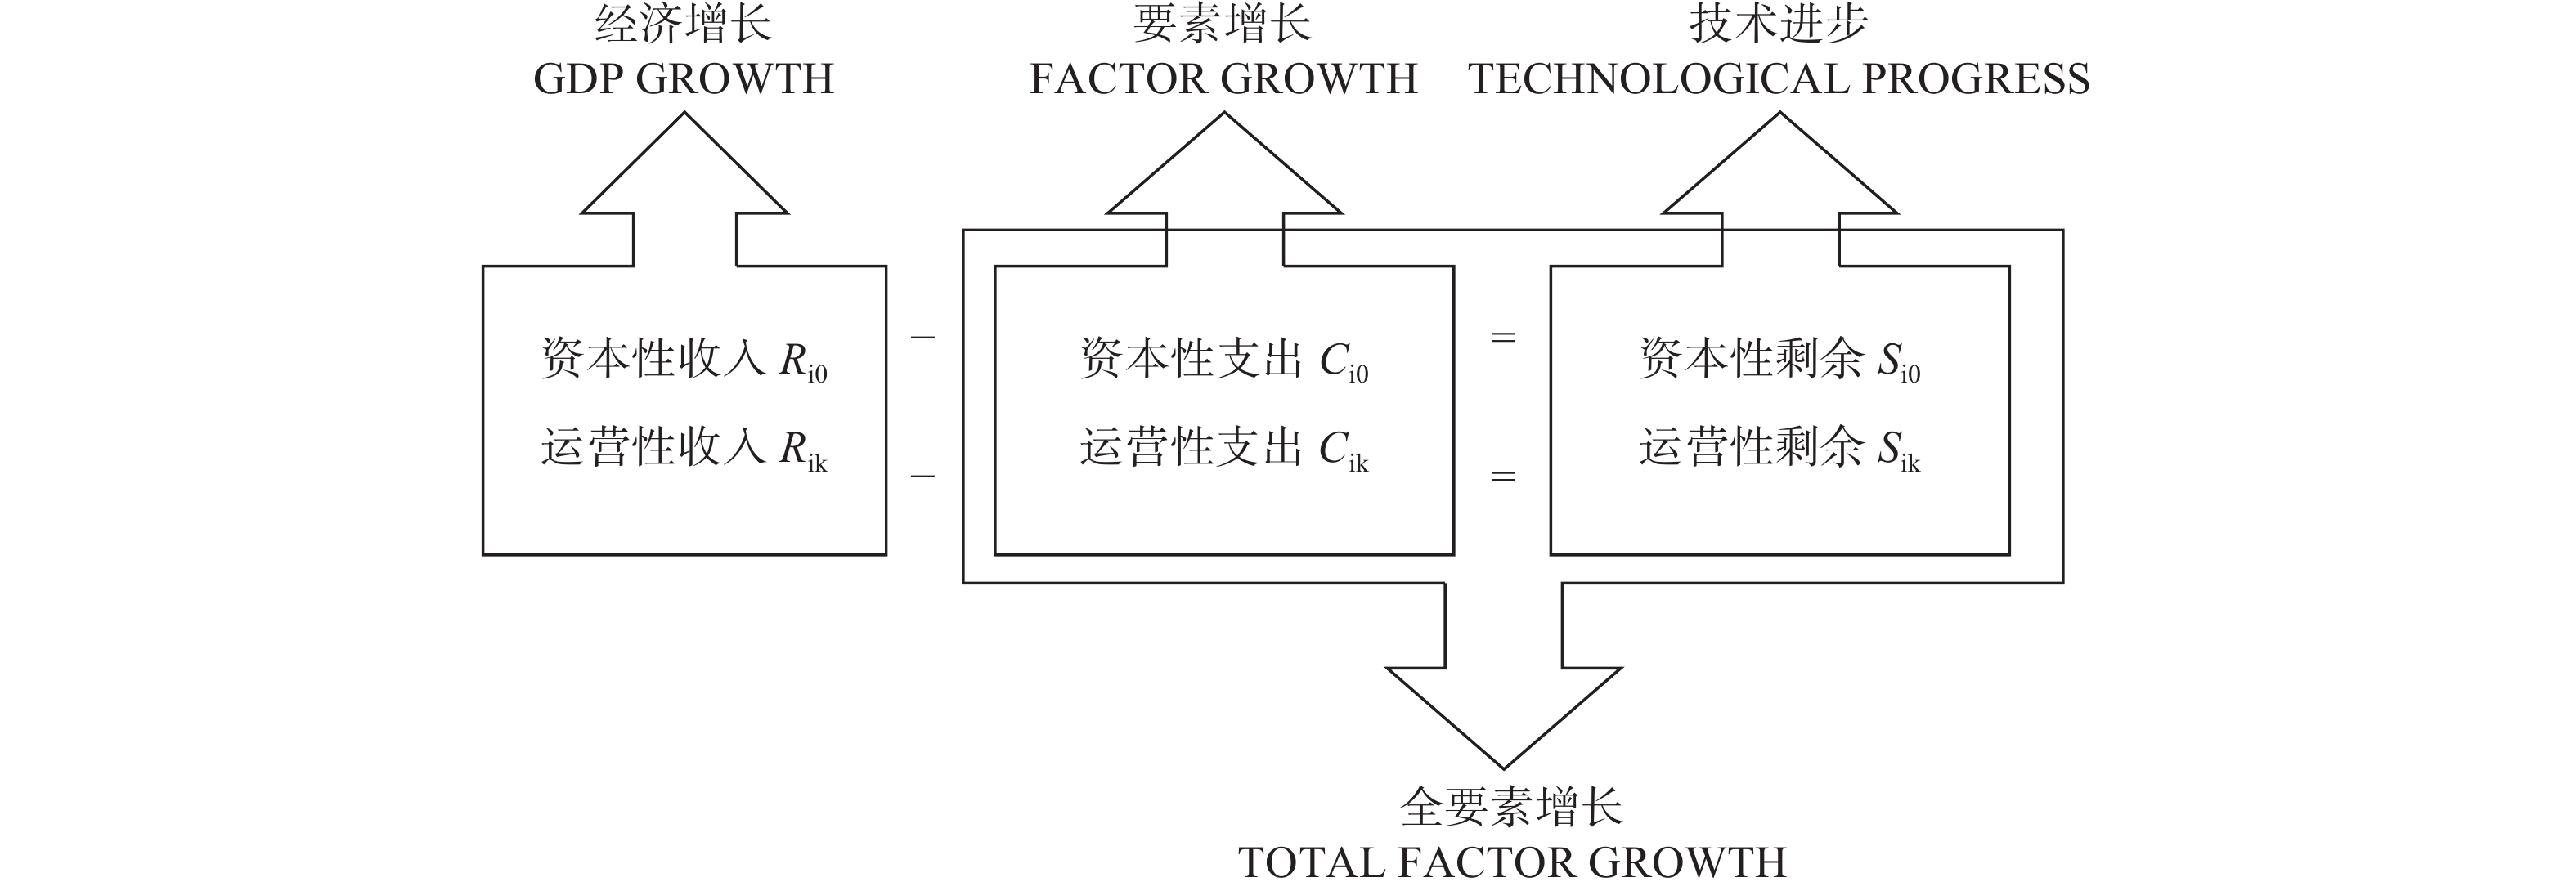
表 1 两阶段增长模型中各变量的含义
收入 支出 剩余 资本型 家庭持有的股票和房地产、企业获得的贷款、政府发行的债券等 家庭购买住房和耐用消费品,企业购买设备和土地,政府投资建设基础设施、教育和研发等公共服务等 家庭、企业和政府融资的结余 劳动型 家庭的获得的工资和房租、企业剩余的利润、政府征收的税收等 家庭支付的电费、水费等日常支出,工厂支付的工人工资、纳税和资本付息等,政府给公务员发工资、基础设施折旧和日常维护等 家庭收入中支付水费、电费和其他各项日常支出后的结余,企业付完工人工资、原材料、税收等成本后的净结余,政府的预算结余等  下载: 导出CSV
表 2 变量的基本统计量与数据定义
变量名称 平均值 标准差 最小值 最大值 样本量 数据定义 ln_gdp 578.5 73.38 369.9 728.5 2431 人均实际GDP的对数值 ratio_r_e 1.479 1.286 0.25 10.76 2431 房地产投资与财政支出的比例 ratio_r_r 0.764 0.576 0.116 4.173 2431 房地产投资与财政收入的比例 ratio_h_e 2.173 2.244 0.342 19.92 2431 住宅投资与财政支出的比例 ratio_h_r 1.111 0.935 0.161 6.809 2431 住宅投资与财政收入的比例 second_indu 51.32 11.66 17.09 90.38 2431 二产占GDP的比例 third_indu 41.47 10.63 8.61 80.23 2431 三产占GDP的比例 wage 3.538 2.014 0.197 57.65 2431 人均在岗职工工资 unemp 0.01 0.386 −3.433 3.595 2431 失业率 road_per 10.31 7.632 0.31 108.4 2431 人均道路使用面积 k1 percapita 26000 24000 1445 210000 2431 资本积累水平1:人均固定资本存量 k2 percapita 5413 6339 144.6 46000 2431 资本积累水平2:人均房地产资本存量 k3 percapita 3814 4304 82.87 31000 2431 资本积累水平3:人均住宅资本存量 注:(1)人均实际GDP是名义GDP经过GDP平减指数处理后得到;(2)人均资本存量经过价格指数处理后,采用张军等(2004)的计算方法得到。①
下载: 导出CSV
表 3 门槛效果检验
临界值 F值 P值 1% 5% 10% 单一门槛 327.834*** 0.000 52.065 52.065 52.065 双重门槛 63.974*** 0.000 −99.030 −99.030 −99.030 三重门槛 25.361*** 0.000 2.375 2.375 2.375 注:(1)表中F值和P值都采用自抽样法(Bootstrap)抽样500次后得到的结果;(2)***、**、*分别表示在1%、5%和10%的水平下显著。
下载: 导出CSV
表 4 门槛估计结果与置信区间
门槛估计值 95% 置信区间 单一门槛模型 1723.970 [1670.387, 1936.192] 双重门槛模型 第一门槛值 926.959 [764.093, 3402.925] 第二门槛值 2028.758 [1911.948, 2028.758] 三重门槛模型 17000 [3020.669, 17000.00]
下载: 导出CSV
表 5 不同年份分别处于不同城市化阶段的城市数量
2005 2006 2007 2008 2009 2010 2011 2012 2013 2014 2015 2016 2017 资本型增长阶段 168 154 142 123 102 82 67 44 33 26 16 16 13 现金流型增长阶段 19 33 45 64 85 105 120 143 154 161 171 171 174
下载: 导出CSV
表 6 城市“现金流−资本”结构对城市经济增长的影响
(1) (2) (3) (4) (5) (6) (7) 住宅资本 住宅资本 住宅资本 房地产资本 房地产资本 固定资本 固定资本 second-ind 6.903***
(6.94)7.025***
(7.25)6.641***
(7.15)7.090***
(7.00)6.987***
(7.39)6.766***
(7.31)6.808***
(7.55)third-indu 6.658***
(4.76)6.601***
(5.01)6.338***
(4.91)6.670***
(4.84)6.507***
(5.08)6.510***
(5.01)6.460***
(5.27)wage 12.970**
(2.18)12.192**
(2.11)12.493**
(2.14)12.715**
(2.13)12.185**
(2.11)12.113**
(2.06)11.533**
(2.02)unemp 0.264
(0.22)0.409
(0.35)−0.206
(−0.17)0.091
(0.08)0.987
(0.85)0.519
(0.41)0.592
(0.44)road_per 0.900*
(1.89)0.802*
(1.90)0.903*
(1.96)0.827*
(1.92)0.807*
(1.92)0.825**
(1.98)0.768**
(2.06)ratio_h_e*D1 −3.66***
(−2.79)−3.686***
(−3.54)−5.38***
(−3.85)ratio_h_e*D2 6.119***
(3.34)7.342**
(2.31)5.778***
(2.63)ratio_h_r*D1 −11.31**
(−3.24)−12.070***
(−3.35)ratio_h_r*D2 16.224**
(3.87)16.069***
(3.88)ratio_r_e*D1 −8.067***
(−2.97)−10.73**
(−3.92)ratio_r_e*D2 11.568**
(3.88)11.494**
(2.91)_cons −110.50
(−1.16)−112.268
(−1.23)−82.966
(−0.94)−117.755
(−1.24)−106.207
(−1.21)−89.866
(−1.03)−86.153
(−1.03)N 2431 2431 2431 2431 2431 2431 2431 adj-R2 0.697 0.716 0.710 0.698 0.715 0.710 0.722 F 107.933 150.877 103.511 109.749 155.296 125.579 141.100 注:***、**、*分别表示在1%、5%和10%的水平下显著。
下载: 导出CSV
-

 下载:
下载:

 点击查看大图
图(2)表(6)
计量
- 文章访问数: 6045
- HTML全文浏览量: 973
 沪公网安备 31010102003103号