
中国服务业全要素生产率的再测算与影响因素分析
Re-measurement and Influence Factors of Total Factor Productivity in China’s Service Industry
-
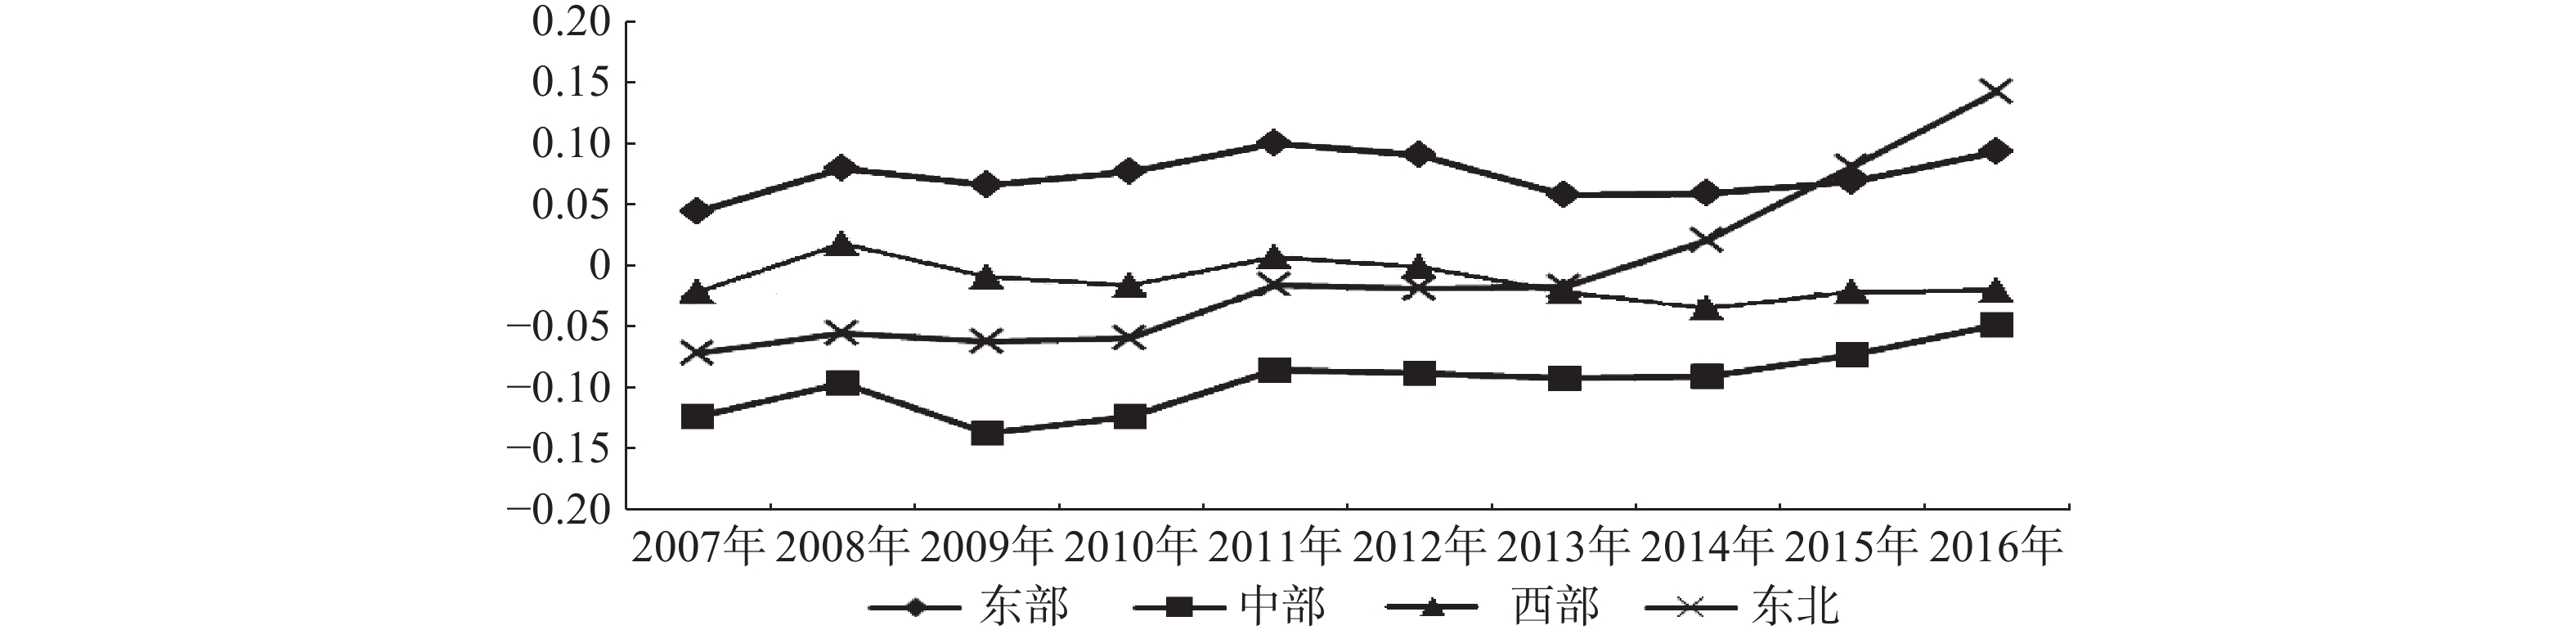
摘要: 在服务业高质量发展大背景下,本文采用半参数的OP法,对中国自2007−2016年间服务业全要素生产率进行了测算。研究发现:在服务业细分行业中,房地产和金融业等共计7个行业的技术进步程度,在直观上要高于公共管理和社会组织以及卫生、社会保障和社会福利业等行业。在分地区中,北京、上海、浙江、广东等地的技术进步程度明显高于中西部省区市。从增长趋势来看,服务业内部不同行业之间增减不一,但自2007年以来,中国服务业全要素生产率整体呈现出明显的递增态势。虽然部分行业在技术进步方面存在短板,但从发展趋势来看,这些差距正在明显缩小。在四大经济区域中,除了西部地区呈现下降趋势外,东部、中部和东北地区的服务业全要素生产率明显上升。从影响因素来看,服务业发展水平、城市化率、贸易依存度和人口出生率,都是促进服务业全要素生产率增长的重要变量。据此,应实行大力促进服务业“提质增效”、稳步提升城市化发展水平、促进对外贸易平稳健康发展和出台切实有效的人口管理办法等政策措施。Abstract: This paper uses the semi-parametric OP method (Olley and Pakes, 1996) to measure the total factor productivity of the service industry in China from 2007 to 2016. The study found that in the sub-sectors of the service industry, the degree of technological progress of seven industries, including real estate and finance, is higher than that of public management and social organizations, as well as health, social security and social welfare industries intuitively. In the sub-regions, the degree of technological progress of Beijing, Shanghai, Zhejiang, Guangdong and other places is significantly higher than that of the central and western provinces and cities. From the perspective of growth trends, there are different increases and decreases between different industries within the service industry. However, since 2007, the total factor productivity of China’s service industry has shown a significant increase. Although some industries have shortcomings in technological progress, these gaps are shrinking significantly in terms of development trends.Among the four major economic regions, in addition to the downward trend in the western region, the total factor productivity of the service industry in the eastern, central and northeastern regions of China has increased significantly. From the perspective of influencing factors, the level of service industry development, urbanization rate, trade dependence and birth rate are all important variables to promote the growth of total factor productivity in the service industry.
-
表 1 中国服务业各行业全要素生产率(2007−2016年)
行业 2007年 2008年 2010年 2012年 2014年 2016年 房地产业 0.7781 0.7773 0.8258 0.7527 0.5480 0.4761 公共管理和社会组织 −0.7577 −0.7057 −0.6698 −0.6094 −0.5870 −0.5773 交通运输、仓储及邮电通信业 −0.1768 −0.1338 −0.0829 −0.0230 −0.1370 −0.1756 教育业 −0.8354 −0.7788 −0.6900 −0.6134 −0.5830 −0.5691 金融业 0.2257 0.2518 0.3052 0.3506 0.4175 0.3413 居民服务和其他 0.0962 0.1617 0.1998 0.2865 0.2717 0.2396 科学研究、技术服务和地质勘查业 −0.0829 −0.0314 0.0010 0.0526 0.0344 −0.0028 批发和零售业 0.1464 0.2304 0.3343 0.2597 0.1881 0.1558 水利、环境和公共设施管理业 −0.3531 −0.3020 −0.2701 −0.1985 −0.1761 −0.2173 卫生、社会保障和社会福利业 −0.4760 −0.4307 −0.3892 −0.3118 −0.2975 −0.3190 文化、体育和娱乐业 0.0206 0.0658 0.1182 0.2153 0.2495 0.2301 信息传输、计算机服务和软件业 0.1472 0.1904 0.1944 0.2408 0.1836 0.1414 住宿和餐饮业 0.3242 0.3695 0.3724 0.2844 0.2859 0.3277 租赁和商务服务 −0.2388 −0.1967 −0.1791 −0.0292 −0.0914 −0.1680 资料来源:作者计算。  下载: 导出CSV
表 2 中国各省区市服务业全要素生产率(2007−2016年)
省区市 2007年 2008年 2009年 2012年 2014年 2016年 均值 上海市 0.1873 0.2326 0.2528 0.2935 0.2068 0.2695 0.2456 天津市 0.1805 0.2062 0.2129 0.2439 0.2603 0.2727 0.2397 宁夏 0.1977 0.2536 0.2583 0.2576 0.1969 0.2240 0.2371 西藏 0.1848 0.2449 0.2394 0.2413 0.1861 0.1365 0.2091 青海省 0.1704 0.2217 0.1583 0.1031 0.1323 0.1426 0.1513 江苏省 0.0587 0.1004 0.1045 0.1755 0.0883 0.1582 0.1207 海南省 0.1304 0.1452 0.1037 0.1087 0.0781 0.0710 0.1004 内蒙古 0.0232 0.1012 0.0867 0.1269 0.0887 0.1349 0.0975 福建省 0.0562 0.0910 0.1007 0.0665 0.0101 0.0388 0.0575 浙江省 0.0386 0.0893 0.0674 0.0385 0.0308 0.0582 0.0567 广东省 0.0408 0.0720 0.0589 0.0654 0.0060 0.0379 0.0431 吉林省 −0.0558 −0.0319 −0.0329 0.0301 0.0593 0.0897 0.0205 北京市 −0.0844 −0.0017 −0.0433 0.0148 0.0401 0.0686 0.0044 黑龙江省 −0.0675 −0.0472 −0.0639 0.0012 0.0558 0.1210 0.0040 重庆市 −0.0866 −0.0557 −0.0598 −0.0196 −0.0082 0.0325 −0.0302 山东省 −0.0662 −0.0559 −0.0757 −0.0093 −0.0158 0.0279 −0.0311 辽宁省 −0.0912 −0.0884 −0.0888 −0.0860 −0.0542 0.2179 −0.0410 江西省 −0.1193 −0.0645 −0.0893 −0.0101 −0.0425 0.0066 −0.0478 新疆 −0.0271 −0.0228 −0.0411 −0.0478 −0.0666 −0.0877 −0.0494 湖南省 −0.0891 −0.0530 −0.0839 −0.0564 −0.0422 −0.0051 −0.0527 甘肃省 −0.0384 −0.0249 −0.0465 −0.0262 −0.0803 −0.0877 −0.0547 山西省 −0.0470 −0.0190 −0.1250 −0.0593 −0.0797 −0.0007 −0.0606 湖北省 −0.0839 −0.0572 −0.0898 −0.0690 −0.0623 −0.0563 −0.0676 贵州省 −0.0465 0.0145 −0.0257 −0.0704 −0.1521 −0.1504 −0.0760 河北省 −0.0962 −0.0822 −0.1250 −0.0912 −0.1165 −0.0705 −0.1012 广西 −0.1106 −0.0880 −0.1258 −0.1070 −0.1032 −0.0971 −0.1116 安徽省 −0.1363 −0.1293 −0.1549 −0.1247 −0.1378 −0.0630 −0.1236 云南省 −0.1583 −0.1191 −0.1534 −0.1241 −0.1659 −0.1692 −0.1462 陕西省 −0.1947 −0.1570 −0.1761 −0.1710 −0.2200 −0.1843 −0.1849 四川省 −0.1781 −0.1494 −0.2241 −0.1665 −0.2216 −0.1371 −0.1851 河南省 −0.2645 −0.2574 −0.2800 −0.2109 −0.1855 −0.1743 −0.2239 资料来源:作者计算。
下载: 导出CSV
表 3 各变量描述性统计
变量 涵义 观测值 均值 标准差 最小值 最大值 TFP 全要素生产率 310 −1.89e−07 0.1314 −0.2800 0.2955 city 城市化率 310 0.5259 0.1433 0.2145 0.8961 service 服务业规模 310 0.4281 0.0911 0.2830 0.8023 market 市场化程度 310 0.4606 0.1650 0.0240 0.8484 trade 贸易依存度 310 0.3016 0.3643 0.0321 1.7215 birth 人口出生率 310 1.1395 0.1314 −0.2800 0.2955 注:作者计算。
下载: 导出CSV
表 4 服务业全要素生产率影响因素回归分析一览表
(一) (二) (三) (四) (五) (六) citypt 0.125**(0.041) 0.022(0.829) 0.0169(0.873) servicept 0.394***(0.000) 0.557***(0.000) 0.568***(0.000) 0.567***(0.000) 0.5639***(0.000) marketpt −0.119***(0.010) −0.110***(0.000) −0.110***(0.001) −0.1158**(0.013) tradept 0.009(0.714) 0.009(0.920) 0.0081(0.736) birthpt 0.003(0.467) 0.0027(0.934) 常数C −0.066**(0.041) −0.169***(0.000) −0.196***(0.000) −0.195***(0.000) −0.198***(0.000) −0.203***(0.000) R2 0.1943 0.1973 0.1983 0.1935 0.1929 0.2033 F值 4.23(0.041) 44.58(0.000) 19.70(0.000) 19.74(0.000) 14.75(0.000) 11.77(0.000) Obs 310 310 310 310 310 310 注:***、**、*分别表示在1%、5%和10%的置信区间内显著。
下载: 导出CSV
表 5 SYS-GMM回归结果分析
(一) (二) (三) (四) (五) TFPp,t−1 0.8629***(0.000) 0.8759***(0.000) 0.7497***(0.000) 0.7408***(0.000) 0.6619***(0.000) citypt 0.1709***(0.013) 0.2194***(0.011) 0.5318***(0.000) 0.5237***(0.000) 0.7369***(0.000) servicept −0.1129*(0.099) −0.1013(0.541) −0.0963(0.582) −0.1246(0.619) marketpt −0.1919***(0.003) −0.1891***(0.008) −0.2540***(0.000) tradept 0.0072(0.188) 0.0147(0.128) birthpt 0.0583(0.331) 常数C −0.0856**(0.026) −0.0627*(0.099) −0.1437**(0.032) −0.1450**(0.028) −0.2844***(0.010) 时间固定效应 控制 控制 控制 控制 控制 AR(1) −3.26(0.001) −3.14(0.002) −2.72(0.007) −3.24(0.001) −3.01(0.003) AR(2) −3.28(0.111) −3.09(0.122) −2.38(0.117) −2.39(0.173) −1.36(0.175) Sargan值 140.37(0.100) 133.81(0.109) 118.15(0.110) 119.89(0.110) 116.48(0.100) Obs 279 279 279 279 279 注:(1)***、**、*分别表示在1%、5%和10%的置信区间内显著;(2)系统GMM估计采用了“两步法”(two-step)。
下载: 导出CSV
-

 下载:
下载:

 点击查看大图
图(1)表(5)
计量
- 文章访问数: 5268
- HTML全文浏览量: 371
 沪公网安备 31010102003103号