
城乡二元结构转化视域下的中国减贫“奇迹”
The “Miracle” of Poverty Reduction in China from the Perspective of Urban-rural Dual Structure Transformation
-
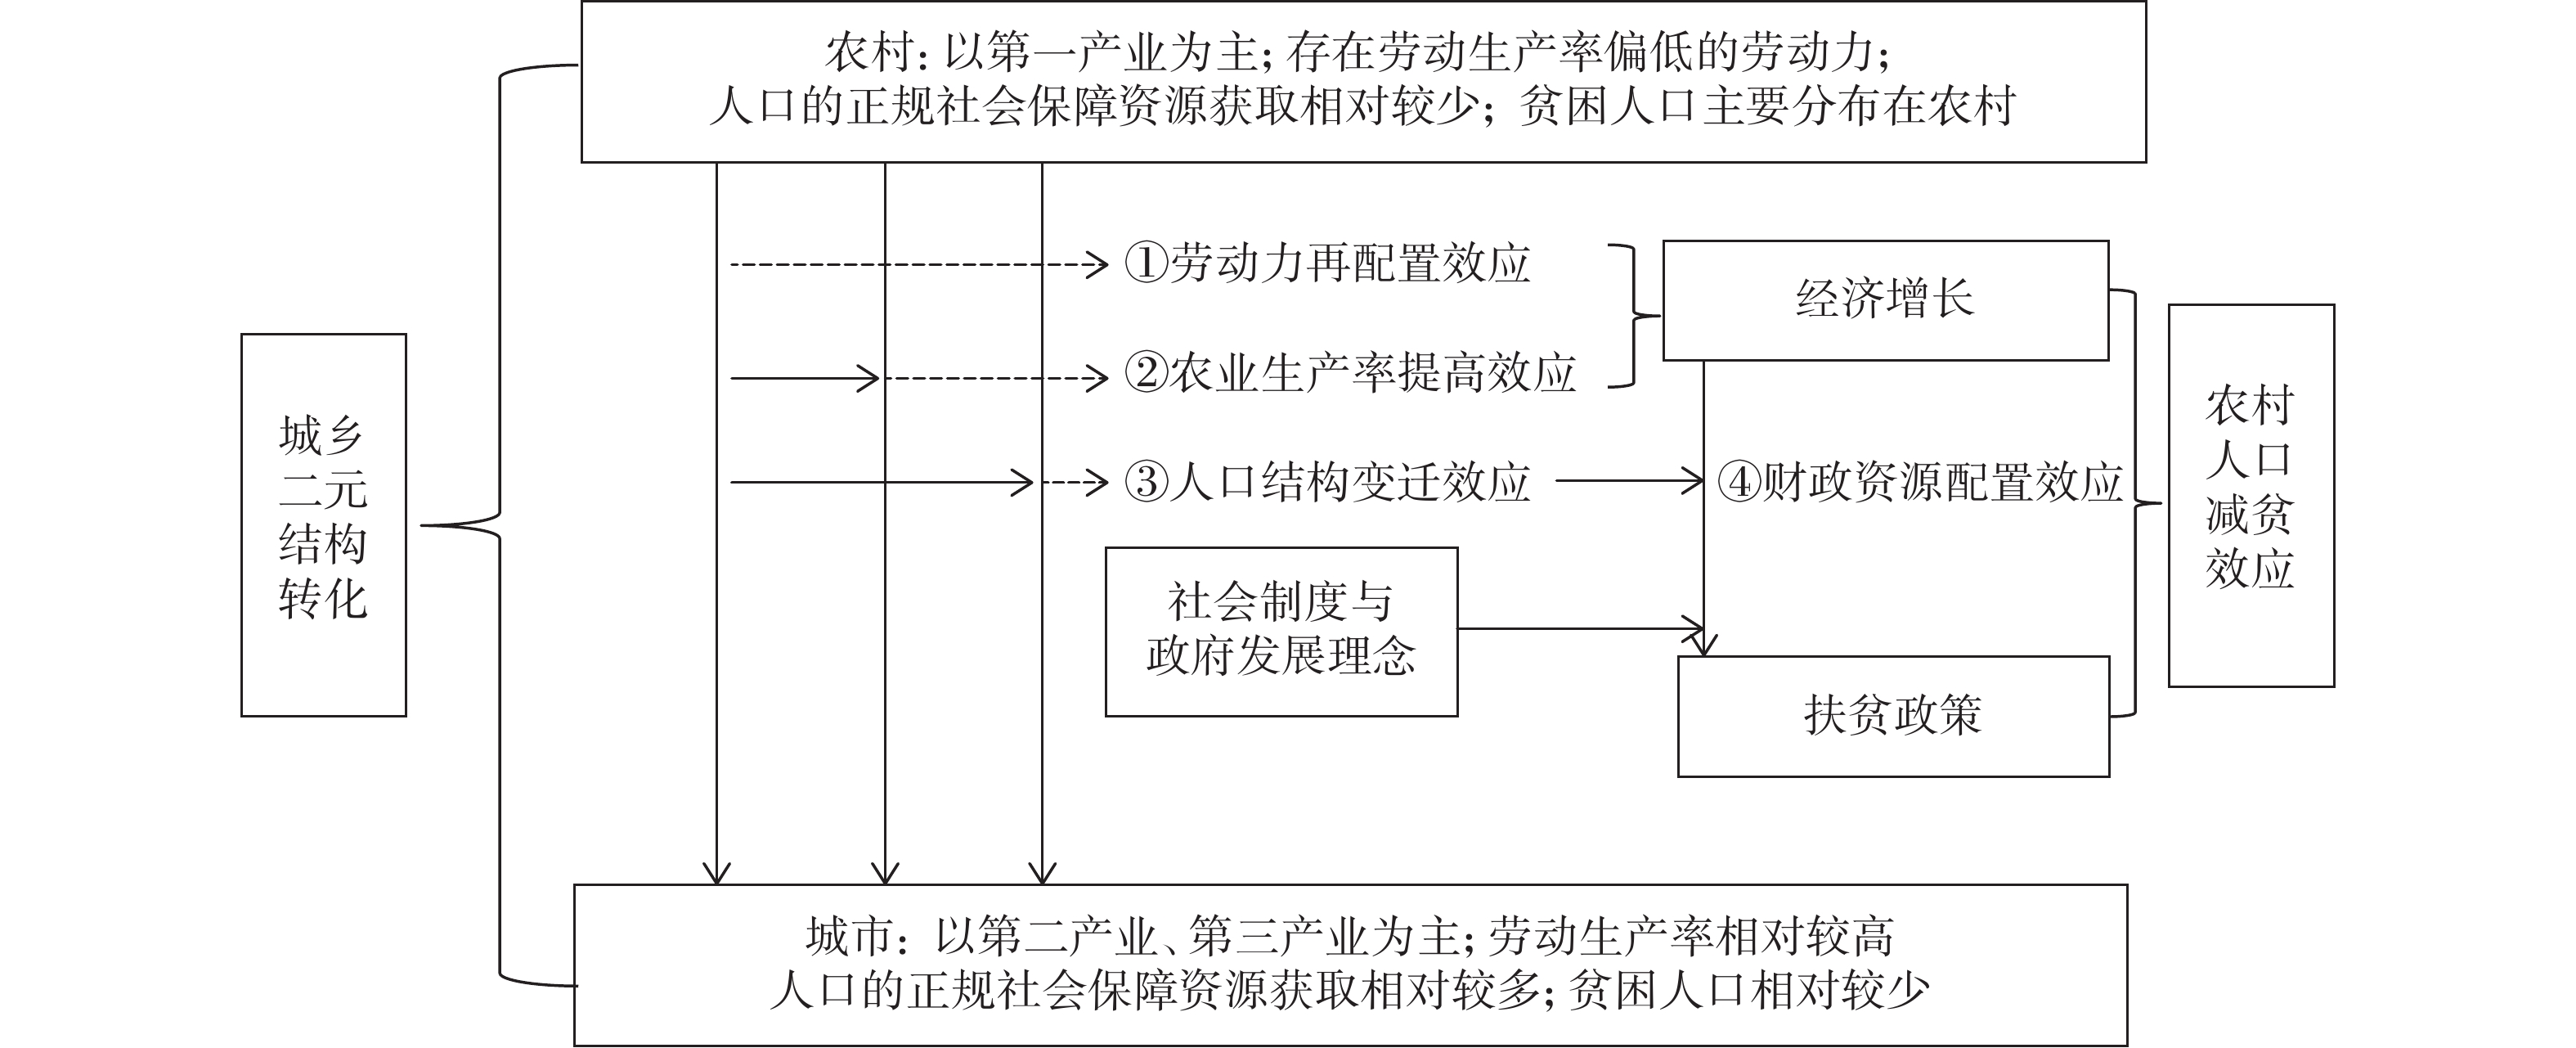
摘要: 减贫是新中国成立以来中国现代化进程的重大主题。中国的减贫历程呈现出三个特征事实:减贫在全球范围取得了“奇迹般”成就,减贫成就主要发生在改革开放后的高增长阶段,减贫历程与城乡二元结构转化过程相伴随。为此应在二元结构转化、经济增长和减贫成就之间形成逻辑内洽的分析框架。在逻辑推演层面,二元结构转化通过劳动力再配置效应、农业生产率提高效应、人口结构变迁效应、财政资源配置效应影响农村减贫,前两者意味着经济增长,后两者则体现为扶贫政策,经济增长和扶贫政策相结合是形成减贫绩效的主要原因。二元结构转化影响减贫的四种效应能够得到中国经验证据的支持,中国的社会主义制度及改革开放后的经济体制转型为效应发挥提供了制度基础。2020年之后,中国减贫战略将进入“下半程”,即应依靠常规方式和长效机制的构建来解决城乡相对贫困问题,这在发展思路和政策取向上需要推动减贫战略与二元结构转化的再衔接。Abstract: Poverty reduction has been a major theme in China’s modernization process since the founding of the People’s Republic of China. This paper points out that the process of poverty reduction in China presents three characteristics: China has achieved “miraculous” poverty reduction achievements in the global scope, the achievements of poverty reduction mainly occur in the high growth stage after the reform and opening up, and the process of poverty reduction is accompanied by the transformation of urban-rural dual structure. The transformation of dual structure affects rural poverty reduction through labor force reallocation effect, agricultural productivity improvement effect, population structure change effect and financial resource allocation effect. The first two effects mean economic growth, and the latter two effects are embodied in poverty alleviation policies. The four effects of dual structure transformation on poverty reduction can be supported by China’s empirical evidence. China’s socialist system and economic system transformation after reform and opening up provide the institutional basis for the effects. After 2020, China’s poverty reduction strategy will enter the “second half”, that is, relying on conventional ways and long-term mechanism construction to solve the problem of urban and rural relative poverty. In terms of development ideas and policy orientation, we need to promote the re-convergence of poverty reduction strategy and dual structure transformation.
-
表 1 中国贫困发生率变化的国际比较(%)
年份 1.9美元(2011年购买力平价) 3.2美元(2011年购买力平价) 5.5美元(2011年购买力平价) 中国 中低等收入国家 中高等收入国家 世界 中国 中低等收入国家 中高等收入国家 世界 中国 中低等收入国家 中高等收入国家 世界 1990 66.2 45.1 40.7 36.0 90.0 74.8 59.9 55.3 98.3 90.0 73.7 67.1 1993 56.6 43.8 35.7 34.0 83.4 74.5 56.9 54.6 96.3 90.8 73.8 68.2 1996 41.7 39.6 27.3 29.5 72.9 72.0 50.6 51.7 92.3 90.0 71.0 67.3 1999 40.2 38.0 26.3 28.6 68.3 71.3 47.9 50.7 88.9 89.9 69.7 66.9 2002 31.7 35.2 20.8 25.5 57.7 68.9 40.3 47.2 80.6 88.6 62.6 64.1 2005 18.5 30.8 12.8 20.7 43.2 65.0 30.7 42.2 70.5 86.4 54.3 60.4 2008 14.8 27.4 9.8 18.1 34.6 61.3 23.8 38.4 60.6 84.5 45.4 56.6 2010 11.2 23.3 7.7 15.7 28.5 56.6 20.0 35.2 53.4 81.7 40.5 53.9 2011 7.9 20.0 5.7 13.7 23.5 52.9 16.8 32.8 49.2 79.7 37.4 52.2 2012 6.5 18.6 4.9 12.8 20.2 50.8 14.8 31.2 44.3 78.3 34.2 50.7 2013 1.9 17.0 2.3 11.2 12.1 48.7 10.2 28.9 36.3 77.4 29.5 48.7 2014 1.4 − − − 9.5 − − − 31.5 − − − 2015 0.7 14.2 1.7 10.0 7.0 44.3 7.5 26.4 27.2 74.8 24.4 46.2 2016 0.5 5.4 23.9 数据来源:世界银行数据库,贫困发生率指贫困人口数量与人口数的比例。  下载: 导出CSV
表 2 中国贫困深度变化的国际比较(%)
年份 1.9美元(2011年购买力平价) 3.2美元(2011年购买力平价) 5.5美元(2011年购买力平价) 中国 中低等收入国家 中高等收入国家 世界 中国 中低等收入国家 中高等收入国家 世界 中国 中低等收入国家 中高等收入国家 世界 1990 24.1 14.5 14.8 12.8 47.0 34.0 29.7 26.7 67.3 54.9 45.6 41.6 1993 20.3 13.7 12.8 12.0 41.4 33.2 26.9 25.7 62.5 54.6 43.5 41.1 1996 12.9 11.9 8.7 9.8 31.7 30.7 21.4 22.9 54.0 52.6 38.5 38.8 1999 13.1 11.0 8.7 9.5 30.5 29.7 20.6 22.3 51.4 51.9 37.1 38.1 2002 10.1 9.6 6.7 8.2 24.6 27.8 16.6 20.1 43.9 50.0 31.6 35.5 2005 4.8 8.1 3.6 6.3 15.4 25.1 10.9 16.8 33.5 47.2 24.5 31.8 2008 3.9 7.0 2.8 5.4 12.4 22.9 8.4 15.0 27.6 44.8 19.6 29.1 2010 2.7 5.9 2.0 4.6 9.6 20.4 6.8 13.4 23.1 41.7 16.7 26.9 2011 1.8 5.0 1.5 4.1 7.4 18.3 5.4 12.1 19.8 39.4 14.6 25.3 2012 1.4 4.7 1.2 3.8 6.2 17.2 4.7 11.3 17.3 38.1 13.0 24.2 2013 0.4 4.2 0.6 3.3 2.8 16.1 2.7 10.2 11.7 36.8 9.8 22.6 2014 0.3 − − − 2.1 − − − 9.7 − − − 2015 0.2 3.6 0.5 3.1 1.4 14.1 2.0 9.3 7.8 34.1 7.7 21.0 2016 0.1 1.0 6.5 数据来源:世界银行数据库,贫困深度指(贫困线收入—贫困人口人均收入)*100%/贫困线收入。
下载: 导出CSV
表 3 1978—2019年中国农村贫困状况的变化情况
年份 1978年标准 2008年标准 2010年标准 城市化率(%) 人均GDP
(元)贫困人口
(万人)贫困发生率(%) 贫困人口
(万人)贫困发生率(%) 贫困人口
(万人)贫困发生率(%) 1978 25000 30.7 77039 97.5 17.92 385 1980 22000 26.8 76542 96.2 19.39 468 1981 15200 18.5 20.16 497 1982 14500 17.5 21.13 533 1983 13500 16.2 21.62 588 1984 12800 15.1 23.01 702 1985 12500 14.8 66101 78.3 23.71 866 1986 13100 15.5 24.52 973 1987 12200 14.3 25.32 1123 1988 9600 11.1 25.81 1378 1989 10200 11.6 26.21 1536 1990 8500 9.4 65849 73.5 26.41 1663 1991 9400 10.4 26.94 1912 1992 8000 8.8 27.46 2334 1993 7500 8.2 27.99 3027 1994 7000 7.7 28.51 4081 1995 6540 7.1 55463 60.5 29.04 5091 1996 5800 6.3 30.48 5898 1997 4962 5.4 31.91 6481 1998 4210 4.6 33.35 6860 1999 3412 3.7 34.78 7229 2000 3209 3.5 9422 10.2 46224 49.8 36.22 7942 2001 2927 3.2 9029 9.8 37.66 8717 2002 2820 3.0 8645 9.2 39.09 9506 2003 2900 3.1 8517 9.1 40.53 10666 2004 2610 2.8 7587 8.1 41.76 12487 2005 2365 2.5 6432 6.8 28662 30.2 42.99 14368 2006 2148 2.3 5698 6.0 44.34 16738 2007 1479 1.6 4320 4.6 45.89 20494 2008 4007 4.2 46.99 24100 2009 3597 3.8 48.34 26180 2010 2688 2.8 16567 17.2 49.95 30808 2011 12238 12.7 51.27 36302 2012 9899 10.2 52.57 39874 2013 8249 8.5 53.73 43684 2014 7017 7.2 54.77 47173 2015 5575 5.7 56.10 50237 2016 4335 4.5 57.35 54139 2017 3046 3.1 58.52 60014 2018 1660 1.7 59.58 66006 2019 551 0.6 60.60 70892 数据来源:1978年标准:1978—1999年称为农村贫困标准,2000—2007年称为农村绝对贫困标准;2008年标准:2000—2007年称为农村低收入标准,2008—2010年称为农村贫困标准:2010年标准即现行农村贫困标准:现行农村贫困标准为每人每年2300元(2010年不变价)。2019年之前的数据来自《中国统计年鉴2019》,2019年的数据来自2020年3月6日习近平总书记在决战决胜脱贫攻坚座谈会上的讲话。城市化率和人均GDP数据来自CEIC数据库。
下载: 导出CSV
-

 下载:
下载:

 点击查看大图
图(1)表(3)
计量
- 文章访问数: 1605
- HTML全文浏览量: 113
 沪公网安备 31010102003103号